欢迎访问作物学报,今天是
作物学报 ›› 2021, Vol. 47 ›› Issue (3): 530-545.doi: 10.3724/SP.J.1006.2021.03021
苏文楠1,2, 解君2, 韩娟1,2, 刘铁宁1,2, 韩清芳1,2,*( )
)
SU Wen-Nan1,2, XIE Jun2, HAN Juan1,2, LIU Tie-Ning1,2, HAN Qing-Fang1,2,*()
摘要:
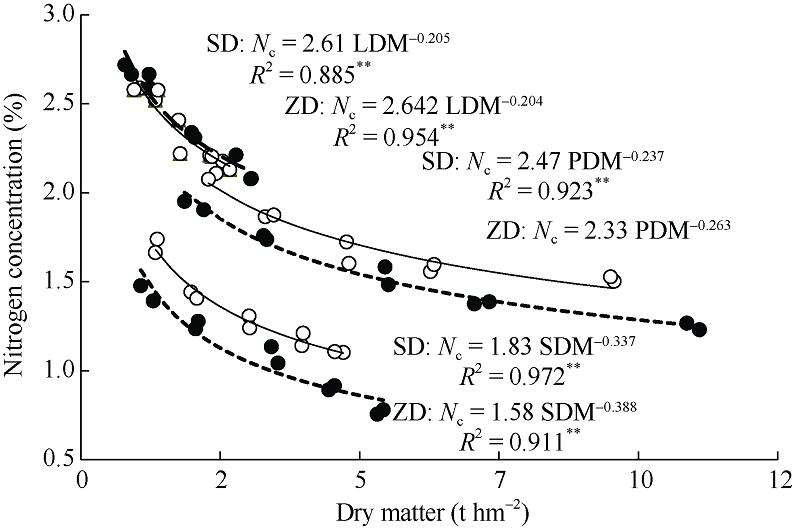
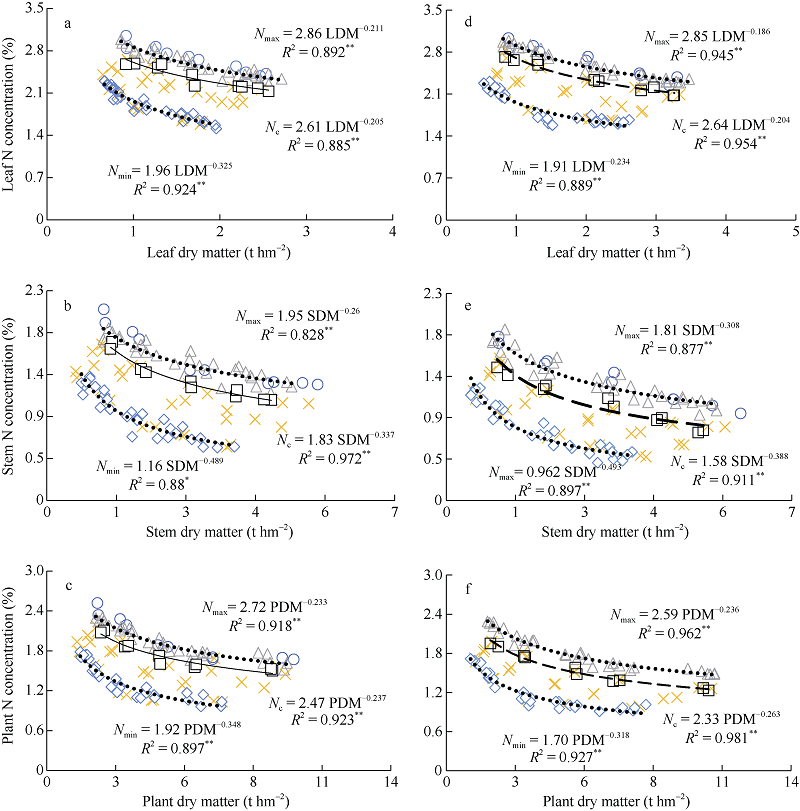
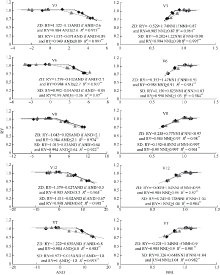
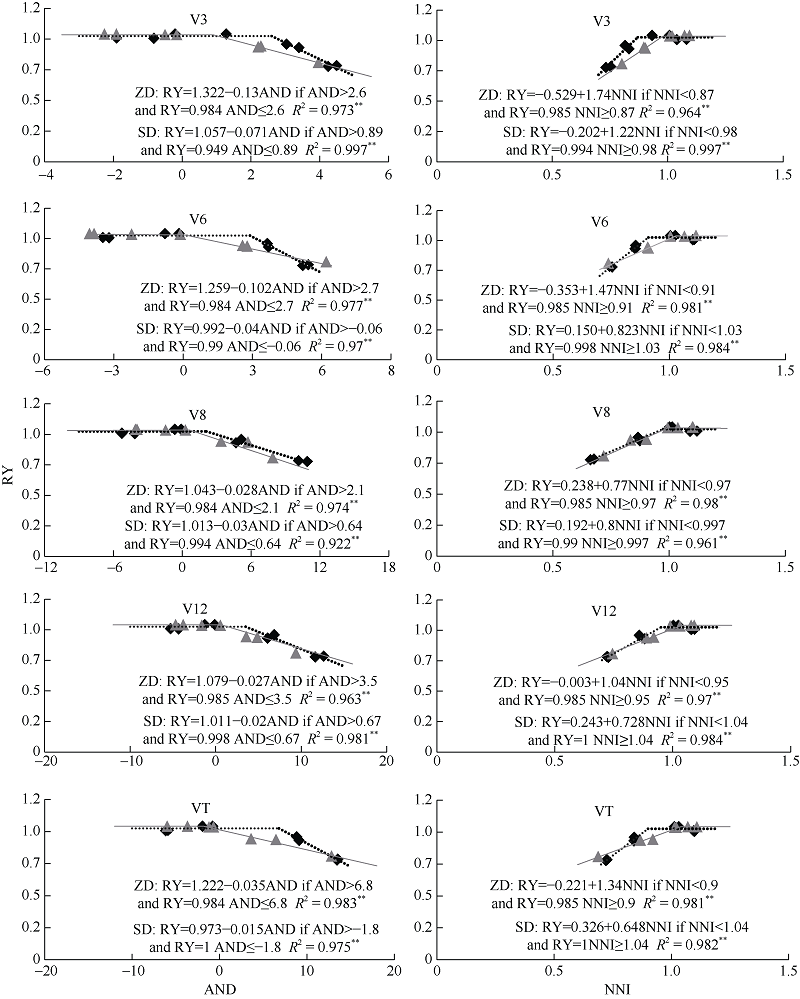
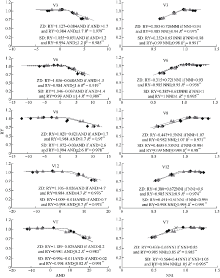
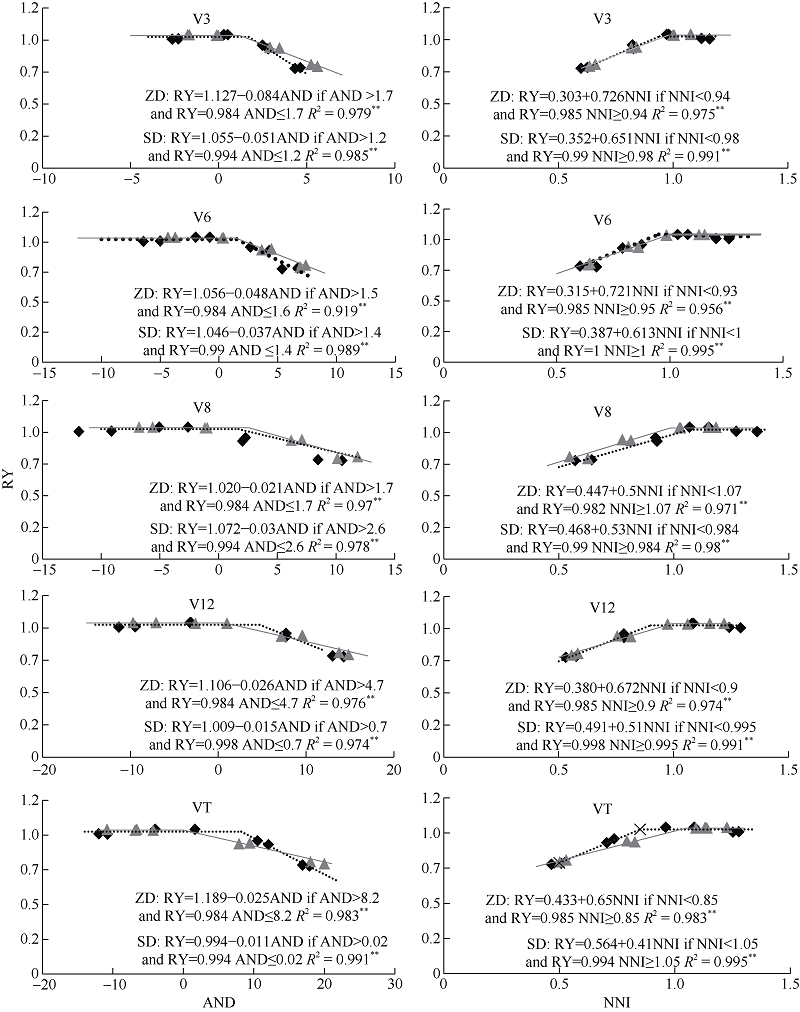
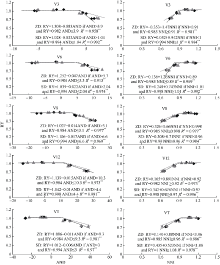
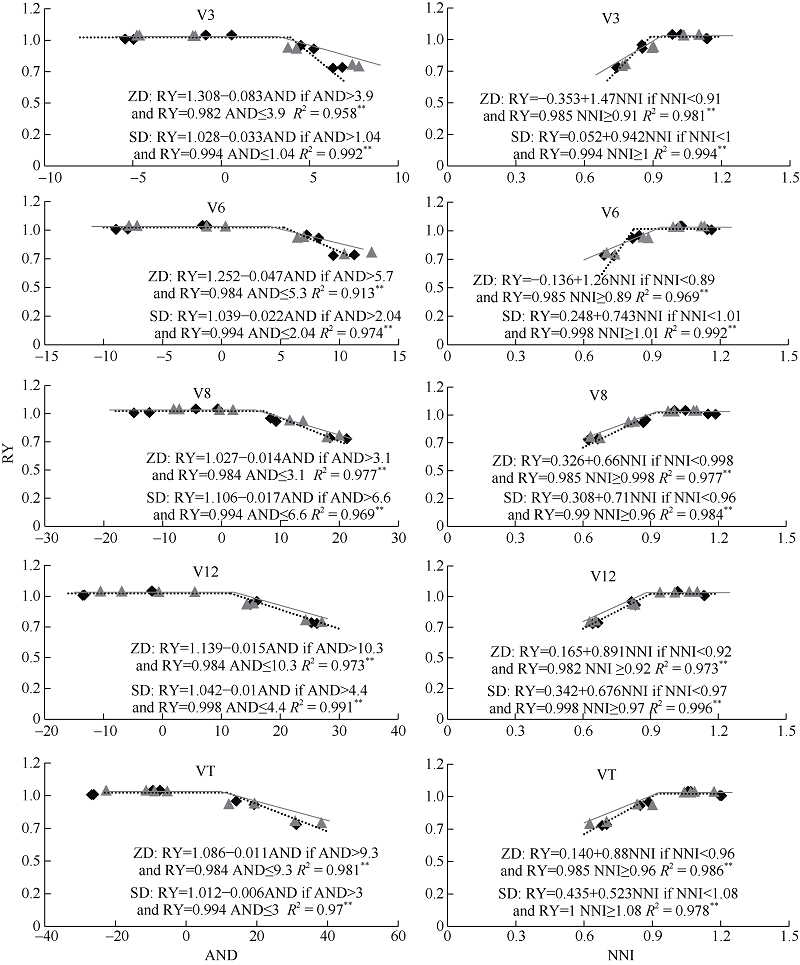
准确和动态地诊断营养生长阶段植株氮状况, 对于评估植物氮需求、预测玉米产量以及优化氮素管理至关重要。基于植物的氮诊断工具可优化夏玉米生产中氮素的管理, 本研究旨在开发和验证基于玉米地上部不同部位干物质的临界氮浓度稀释曲线, 并建立玉米相对产量(relative yield, RY)与不同生长阶段氮素营养指数(nitrogen nutrition index, NNI)和累积氮素亏缺(accumulated nitrogen deficit, AND)的关系。本文以2个不同氮效率的品种为试验材料进行连续4年的田间定位试验, 设置4个氮素水平(0、150、225和300 kg hm-2), 分析不同施氮量对2个玉米品种营养生长阶段干物质的影响, 基于叶干物质(leaf dry matter, LDM)、茎干物质(stem dry matter, SDM)和植物干物质(plant dry matter, PDM), 构建不同的临界氮浓度稀释曲线。结果表明, 基于LDM、SDM和PDM建立的临界氮浓度稀释曲线, 均能很好地诊断玉米氮营养状况; 3条临界氮浓度稀释曲线对产量进行预测比较发现, RY与NNI和AND在不同生长阶段之间的相关性均达到显著水平, 相关系数R2值均大于0.65, 其中R2值在V12-VT时期最大, 同时回归模型的验证结果表明, 在V12-VT时期模型显示出可靠性。R2值大于0.92, RMSE值小于10%, 证实了模型在V12和VT两个时期关系的稳定性。总的来说, 一定的条件下, 基于LDM和SDM建立的临界氮浓度稀释曲线可以对基于PDM建立的临界氮浓度稀释曲线进行代替。在V12-VT阶段, RY与NNI和AND的稳定关系很好地说明了在受氮素限制和非氮素限制下RY的变化, 并对夏玉米产量进行准确的估计。本研究为花前玉米的氮肥管理提高粮食产量提供理论依据。
| [1] | Erisman J W, Sutton M A, Galloway J, Klimont Z, Winiwarter W. How a century of ammonia synthesis changed the world. Nat Geosci, 2008,1:636-639. |
| [2] | 王西娜, 王朝辉, 李生秀. 施氮量对夏季玉米产量及土壤水氮动态的影响. 生态学报, 2007,27(1):197-204. |
| Wang X N, Wang Z H, Li S X. The effect of nitrogen fertilizer rate on summer maize yield and soil water nitrogen dynamics. Acta Ecol Sin, 2007,27(1):197-204 (in Chinese with English abstract). | |
| [3] | Ramanantenasoa M M J, Génermont S, Gilliot J M, Makowski D. Metamodeling methods for estimating ammonia volatilization from nitrogen fertilizer and manure applications. J Environ Manag, 2019,236:195-205. |
| [4] | Galloway J N, Cowling E B. Reactive nitrogen and the world: 200 years of change. Ambio, 2002,3:64-71. |
| [5] | 宁芳, 张元红, 温鹏飞, 王瑞, 王倩, 董朝阳, 贾广灿, 李军. 不同降水状况下旱地玉米生长与产量对施氮量的响应. 作物学报, 2019,45:777-791. |
| Ning F, Zhang Y H, Wen P F, Wang R, Wang Q, Dong Z Y, Jia G C, Li J. Responses of maize growth and yield to nitrogen application in dryland under different precipitation conditions. Acta Agron Sin, 2019,45:777-791 (in Chinese with English abstract). | |
| [6] |
Zhao B, Ata-Ul-Karim S T, Liu Z D, Zhang J Y, Xiao J F, Liu Z G, Qin A Z, Ning D F, Yang Q X, Zhang Y H, Duan A W. Simple assessment of nitrogen nutrition index in summer maize by using chlorophyll meter readings. Front Plant Sci, 2018,9:11.
doi: 10.3389/fpls.2018.00011 pmid: 29403521 |
| [7] | Zhao B, Liu Z D, Ata-Ul-Karim S T, Xiao J F, Liu Z G, Qi A Z, Ning D F, Nan J Q, Duan A W. Rapid and nondestructive estimation of the nitrogen nutrition index in winter barley using chlorophyll measurements. Field Crops Res, 2016,185:59-68. |
| [8] | Justes E, Mary B, Meynard J M, Machet J M, Thelier-Huche L. Determination of A critical nitrogen dilution curve for winter-wheat Crops. Ann Bot, 1994,74:397-407. |
| [9] | Ata-Ul-Karim S T, Yao X, Liu X J, Cao W X, Zhu Y. Development of critical nitrogen dilution curve ofjaponica rice in Yangtze River Reaches. Field Crops Res, 2013,149:149-158. |
| [10] | Zhao B, Ata-Ul-Karim S T, Liu Z, Ning D F, Xiao J F, Liu Z G, Qin A Z, Nan J Q, Duan A W. Development of a critical nitrogen dilution curve based on leaf dry matter for summer maize. Field Crops Res, 2017,208:60-68. |
| [11] |
Wang X L, Ye T Y, Ata-Ul-Karim S T, Zhu Y, Liu L L, Cao W X, Tang L. Development of a critical nitrogen dilution curve based on leaf area duration in wheat. Front Plant Sci, 2017,8:1517.
pmid: 28928757 |
| [12] | 付江鹏, 贺正, 贾彪, 刘慧芳, 李振洲, 刘志. 滴灌玉米临界氮稀释曲线与氮素营养诊断研究. 作物学报, 2020,46:290-299. |
| Fu J P, He Z, Jia B, Liu H F, Li Z Z, Liu Z. Critical nitrogen dilution curve and nitrogen nutrition diagnosis of maize with drip irrigation. Acta Agron Sin, 2020,46:290-299 (in Chinese with English abstract). | |
| [13] | Ata-Ul-Karim S T, Liu X J, Lu Z Z, Yuan Z F, Zhu Y, Cao W X. In-season estimation of rice grain yield using critical nitrogen dilution curve. Field Crops Res, 2016,195:1-8. |
| [14] | Ata-Ul-Karim S T, Liu X J, Lu Z Z, Zheng H B, Cao W X, Zhu Y. Estimation of nitrogen fertilizer requirement for rice crop using critical nitrogen dilution curve. Field Crops Res, 2017,201:32-40. |
| [15] | 岳松华, 刘春雨, 黄玉芳, 叶优良. 豫中地区冬小麦临界氮稀释曲线与氮营养指数模型的建立. 作物学报, 2016,42:909-916. |
| Yue S H, Liu C Y, Huang Y F, Ye Y L. Simulating critical nitrogen dilution curve and modeling nitrogen nutrition index in winter wheat in central Henan area. Acta Agron Sin, 2016,42:909-916 (in Chinese with English abstract). | |
| [16] | Yao Y K, Miao Y X, Cao Q, Wang H Y, Gnyp M L, Bareth G, Khosla R, Yang W, Liu F Y, Liu C. In-season estimation of rice nitrogen status with an active crop canopy sensor. IEEE J-Stars, 2014,7:4403-4413. |
| [17] | Ziadi N, Bélanger G, Claessens A, Lefebvre L, Cambouris A N, Tremblay N, Nolin M C, Parent L E. Determination of a critical nitrogen dilution curve for spring wheat. Agron J, 2010,102:241-250. |
| [18] | Lemaire G, Jeuffroy M H, Gastal F. Diagnosis tool for plant and crop N status in vegetative stage: Theory and practices for crop N management. Eur J Agron, 2008,28:614-624. |
| [19] | Zhang K, Yuan Z F, Yang T C, Lu Z Z, Cao Q, Tian Y C, Zhu Y, Cao W X, Liu X J. Chlorophyll meter-based nitrogen fertilizer optimization algorithm and nitrogen nutrition index for in-season fertilization of paddy rice. Agron J, 2020,112:1-13. |
| [20] | Ziadi N, Brassard M, Bélanger G, Claessens A, Tremblay N, Cambouris A, Nolin M, Parent L E. Chlorophyll measurements and nitrogen nutrition index for the evaluation of corn nitrogen status. Agron J, 2008,100:271-273. |
| [21] |
Ata-Ul-Karim S T, Yao X, Liu X J, Cao W X, Zhu Y. Determination of critical nitrogen dilution curve based on stem dry matter in rice. PLoS One, 2014,9:e104540.
doi: 10.1371/journal.pone.0104540 pmid: 25127042 |
| [22] |
Ata-Ul-Karim S T, Zhu Y, Liu X J, Cao Q, Tian Y C, Cao W X. Comparison of different critical nitrogen dilution curves for nitrogen diagnosis in rice. Sci Rep, 2017,7:42679.
doi: 10.1038/srep42679 pmid: 28262685 |
| [23] | Yao X, Zhao B, Tian Y C, Liu X J, Ni J, Cao W X, Zhu Y. Using leaf dry matter to quantify the critical nitrogen dilution curve for winter wheat cultivated in eastern China. Field Crops Res, 2014,159:33-42. |
| [24] | Huang S Y, Miao Y X, Cao Q, Yao Y K, Zhao G M, Yu W F, Shen J N, Yu K, Bareth G. A new critical nitrogen dilution curve for rice nitrogen status diagnosis in Northeast China. Pedosphere, 2018,28:814-822. |
| [25] | Zhao B, Yao X, Tian Y C, Liu X J, Ata-Ul-Karim S T, Ni J, Cao W X, Zhu Y. New critical nitrogen curve based on leaf area index for winter wheat. Agron J, 2014,106:379-383. |
| [26] | Zhao B, Ata-Ui-Karim S T, Yao X, Tian Y C, Cao W X, Zhu Y Liu X J. A new curve of critical nitrogen concentration based on spike dry matter for winter wheat in Eastern China. PLoS One, 2016,11:e164545. |
| [27] | Zhao Z G, Wang E L, Wang Z M, Zang H Z, Liu Y P, Angus J F. A reappraisal of the critical nitrogen concentration of wheat and its implications on crop modeling. Field Crops Res, 2014,164:65-73. |
| [28] | 强生才, 张富仓, 向友珍, 张燕, 闫世程, 邢英英. 关中平原不同降雨年型夏玉米临界氮稀释曲线模拟及验证. 农业工程学报, 2015,31(17):168-175. |
| Qiang S C, Zhang F C, Xiang Y Z, Zhang Y, Yan S C, Xing Y Y. Simulation and validation of critical nitrogen dilution curve for summer maize in Guanzhong Plain during different rainfall years. Trans CSAE, 2015,31(17):168-175 (in Chinese with English abstract). | |
| [29] | 李正鹏, 冯浩, 宋明丹. 关中平原冬小麦临界氮浓度稀释曲线和氮营养指数研究. 农业机械学报, 2015,46(10):177-183. |
| Li Z P, Feng H, Song M D. Development and validation of critical nitrogen content curve for maize in Guanzhong area. Trans CSAM, 2015,46(10):135-141 (in Chinese with English abstract). | |
| [30] | Bremner J M, Mulvancy C S. Nitrogen-total. In: Page A L, Miller R H, Keeney D R, eds. Methods of Soil Analysis. Madison: American Society of Agronomy, 1982. pp 595-624. |
| [31] | Yang J, Greenwood D J, Rowell D L, Wadsworth G A, Burns I G. Statistical methods for evaluating a crop nitrogen simulation model, N_ABLE. Agric Syst, 2000,64:37-53. |
| [32] | Jamieson P D, Porter J R, Wilson D R. A test of the computer simulation model ARCWHEAT1 on wheat crops grown in New Zealand. Field Crops Res, 1991,27:337-350. |
| [33] |
He Z Y, Qiu X L, Ata-Ul-Karim S T, Li Y D, Liu X J, Cao Q, Zhu Y, Cao W X, Tang L. Development of a critical nitrogen dilution curve of double cropping rice in south China. Front Plant Sci, 2017,8:638.
doi: 10.3389/fpls.2017.00638 pmid: 28503181 |
| [34] | Zhao B, Niu X L, Ata-Ul-Karim S T, Wang L G, Duan A W, Liu Z D, Lemaire G. Determination of the post-anthesis nitrogen status using ear critical nitrogen dilution curve and its implications for nitrogen management in maize and wheat. Eur J Agron, 2020,113:125967. |
| [35] | Song L G, Wang S, Ye W J. Establishment and application of critical nitrogen dilution curve for rice based on leaf dry matter. Agron J, 2020,10:367. |
| [36] | 梁效贵, 张经廷, 周丽丽, 李旭辉, 周顺利. 华北地区夏玉米临界氮稀释曲线和氮营养指数研究. 作物学报, 2013,39:292-299. |
| Liang X G, Zhang J T, Zhou L L, Li X H, Zhou S L. Critical nitrogen dilution curve and nitrogen nutrition index for summer maize in north China plain. Acta Agron Sin, 2013,39:292-299 (in Chinese with English abstract). | |
| [37] | Yue S C, Sun F L, Meng Q F, Zhao R F, Li F, Chen X P, Zhang F S, Cui Z L. Validation of a critical nitrogen curve for summer maize in the North China Plain. Pedosphere, 2014,24:76-83. |
| [38] | Liang X G, Zhang Z L, Zhou L L, Shen S, Gao Z, Zhang L, Lin S, Pan Y Q, Zhou S L. Localization of maize critical N curve and estimation of NNI by Chlorophyll. Int J Plant Prod, 2018,12:85-94. |
| [39] | Novoa R, Loomis R. Nitrogen and plant production. Plant Soil, 1981,58:177-204. |
| [40] | 侯有良, Brien L O, 钟改荣. 小麦不同器官氮素累积分布动态规律的研究. 作物学报, 2001,27:493-499. |
| Hou Y L, Brien L O, Zhong G R. Study on the dynamic change of the distribution and accumulation of nitrogen in different plant parts of wheat. Acta Agron Sin, 2001,27:493-499 (in Chinese with English abstract). | |
| [41] | Sinclair T R, Horie T. Leaf nitrogen, photosynthesis and crop radiation use efficiency: a review. Crop Sci, 1989,29:90-98. |
| [42] | 安志超, 黄玉芳, 汪洋, 赵亚南, 岳松华, 师海斌, 叶优良. 植物营养与肥料学报, 2019,25:123-133. |
| An Z C, Huang Y F, Wang Y, Zhao Y N, Yue S H, Shi H B, Ye Y L. Critical nitrogen concentration dilution model and nitrogen nutrition diagnosis in summer maize with different nitrogen efficiencies. J Plant Nutr Fert, 2019,25:123-133 (in Chinese with English abstract). | |
| [43] | Chen Y L, Xiao C X, Chen X C, Li Q, Zhang J, Chen F J, Yuan L X, Mi G H. Characterization of the plant traits contributed to high grain yield and high grain nitrogen concentration in maize. Field Crops Res, 2014,159:1-9. |
| [44] | 王晓玲. 长江中下游稻麦两熟区冬小麦植株器官临界氮浓度模型构建及氮素诊断调控研究. 南京农业大学博士学位论文, 江苏南京, 2017. |
| Wang X L. Study on Construction Critical Nitrogen Concentration Dilution Models Based on Plant Organs and Diagnosis and Regulation of Wheat in the Middle and Lower Reaches of the Yangtze River. PhD Dissertation of Graduate School of Nanjing Agricultural University, Nanjing, Jiangsu, China, 2017 (in Chinese with English abstract). | |
| [45] | 强生才, 张富仓, 田建柯, 吴悠, 闫世程, 范军亮. 基于叶片干物质的冬小麦临界氮浓度稀释曲线模拟研究. 农业机械学报, 2015,46(11):121-128. |
| Qiang S C, Zhang F C, Tian J K, Wu Y, Yan S C, Fan J L. Deve lopment of critical nitrogen dilution curve in winter wheat based on leaf dry matter. Trans CSAM, 2015,46(11):121-128 (in Chinese with English abstract). | |
| [46] | Stockle C O, Debaeke P. Modeling crop nitrogen requirements: a critical analysis. Eur J Agron, 1997,7:161-169. |
| [47] | 刘朋召, 师祖姣, 宁芳, 王瑞, 王小利, 李军. 不同降雨状况下渭北旱地春玉米临界氮稀释曲线与氮素营养诊断. 作物学报, 2020,46:1225-1237. |
| Liu P Z, Shi Z J, Ning F, Wang R, Wang X L, Li J. Critical nitrogen dilution curves and nitrogen nutrition diagnosis of spring maize under different precipitation patterns in Weibei dryland. Acta Agron Sin, 2020,46:1225-1237 (in Chinese with English abstract). | |
| [48] | Yuan Z F, Ata-Ul-Karim S T, Cao Q, Lu Z Z, Cao W X, Zhu Y, Liu X J. Indicators for diagnosing nitrogen status of rice based on chlorophyll meter readings. Field Crops Res, 2016,185:12-20. |
| [49] | Zhao B, Duan A W, Ata-Ul-Karim S T, Liu Z D, Chen Z F, Gong Z H, Zhang J Y, Xiao J F, Liu Z G, Qin A Z, Ning D F. Exploring new spectral bands and vegetation indices for estimating nitrogen nutrition index of summer maize. Eur J Agron, 2018,93:113-125. |
| [1] | 肖颖妮, 于永涛, 谢利华, 祁喜涛, 李春艳, 文天祥, 李高科, 胡建广. 基于SNP标记揭示中国鲜食玉米品种的遗传多样性[J]. 作物学报, 2022, 48(6): 1301-1311. |
| [2] | 崔连花, 詹为民, 杨陆浩, 王少瓷, 马文奇, 姜良良, 张艳培, 杨建平, 杨青华. 2个玉米ZmCOP1基因的克隆及其转录丰度对不同光质处理的响应[J]. 作物学报, 2022, 48(6): 1312-1324. |
| [3] | 王丹, 周宝元, 马玮, 葛均筑, 丁在松, 李从锋, 赵明. 长江中游双季玉米种植模式周年气候资源分配与利用特征[J]. 作物学报, 2022, 48(6): 1437-1450. |
| [4] | 杨欢, 周颖, 陈平, 杜青, 郑本川, 蒲甜, 温晶, 杨文钰, 雍太文. 玉米-豆科作物带状间套作对养分吸收利用及产量优势的影响[J]. 作物学报, 2022, 48(6): 1476-1487. |
| [5] | 陈静, 任佰朝, 赵斌, 刘鹏, 张吉旺. 叶面喷施甜菜碱对不同播期夏玉米产量形成及抗氧化能力的调控[J]. 作物学报, 2022, 48(6): 1502-1515. |
| [6] | 徐田军, 张勇, 赵久然, 王荣焕, 吕天放, 刘月娥, 蔡万涛, 刘宏伟, 陈传永, 王元东. 宜机收籽粒玉米品种冠层结构、光合及灌浆脱水特性[J]. 作物学报, 2022, 48(6): 1526-1536. |
| [7] | 单露英, 李俊, 李亮, 张丽, 王颢潜, 高佳琪, 吴刚, 武玉花, 张秀杰. 转基因玉米NK603基体标准物质研制[J]. 作物学报, 2022, 48(5): 1059-1070. |
| [8] | 许静, 高景阳, 李程成, 宋云霞, 董朝沛, 王昭, 李云梦, 栾一凡, 陈甲法, 周子键, 吴建宇. 过表达ZmCIPKHT基因增强植物耐热性[J]. 作物学报, 2022, 48(4): 851-859. |
| [9] | 刘磊, 詹为民, 丁武思, 刘通, 崔连花, 姜良良, 张艳培, 杨建平. 玉米矮化突变体gad39的遗传分析与分子鉴定[J]. 作物学报, 2022, 48(4): 886-895. |
| [10] | 闫宇婷, 宋秋来, 闫超, 刘爽, 张宇辉, 田静芬, 邓钰璇, 马春梅. 连作秸秆还田下玉米氮素积累与氮肥替代效应研究[J]. 作物学报, 2022, 48(4): 962-974. |
| [11] | 徐宁坤, 李冰, 陈晓艳, 魏亚康, 刘子龙, 薛永康, 陈洪宇, 王桂凤. 一个新的玉米Bt2基因突变体的遗传分析和分子鉴定[J]. 作物学报, 2022, 48(3): 572-579. |
| [12] | 宋仕勤, 杨清龙, 王丹, 吕艳杰, 徐文华, 魏雯雯, 刘小丹, 姚凡云, 曹玉军, 王永军, 王立春. 东北主推玉米品种种子形态及贮藏物质与萌发期耐冷性的关系[J]. 作物学报, 2022, 48(3): 726-738. |
| [13] | 渠建洲, 冯文豪, 张兴华, 徐淑兔, 薛吉全. 基于全基因组关联分析解析玉米籽粒大小的遗传结构[J]. 作物学报, 2022, 48(2): 304-319. |
| [14] | 张加康, 李斐, 史树德, 杨海波. 内蒙古地区甜菜临界氮浓度稀释模型的构建及应用[J]. 作物学报, 2022, 48(2): 488-496. |
| [15] | 张倩, 韩本高, 张博, 盛开, 李岚涛, 王宜伦. 控失尿素减施及不同配比对夏玉米产量及氮肥效率的影响[J]. 作物学报, 2022, 48(1): 180-192. |
|
||