欢迎访问作物学报,今天是
作物学报 ›› 2020, Vol. 46 ›› Issue (4): 557-570.doi: 10.3724/SP.J.1006.2020.94045
李宗飞1,苏继霞1,费聪1,李阳阳1,刘宁宁1,戴宇祥1,张开祥1,王开勇1,樊华1,*( ),陈兵2,*()
LI Zong-Fei1,SU Ji-Xia1,FEI Cong1,LI Yang-Yang1,LIU Ning-Ning1,DAI Yu-Xiang1,ZHANG Kai-Xiang1,WANG Kai-Yong1,FAN Hua1,*(),CHEN Bing2,*()
摘要:
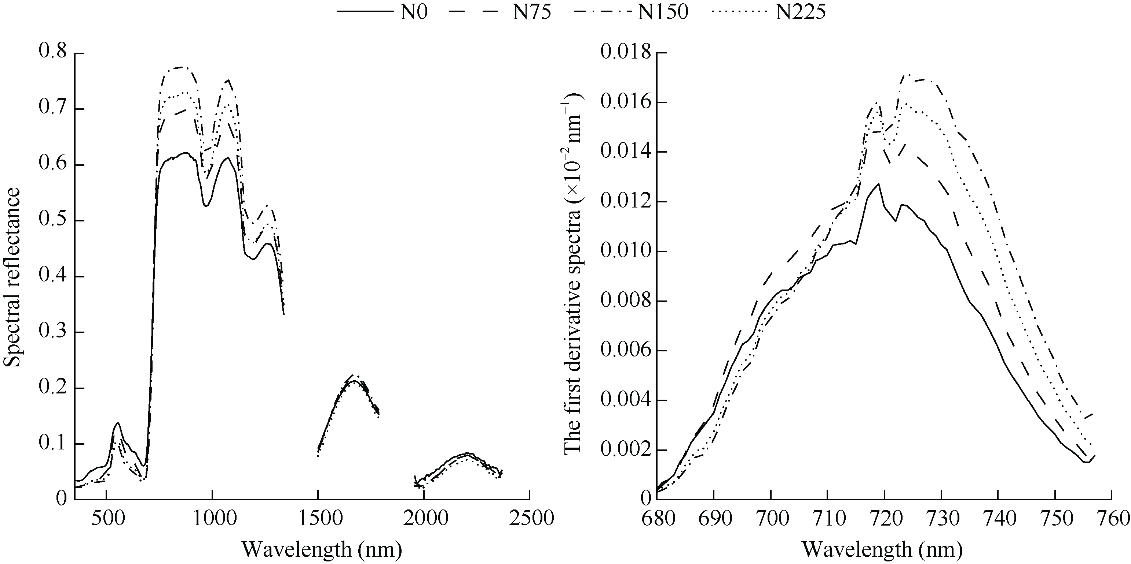
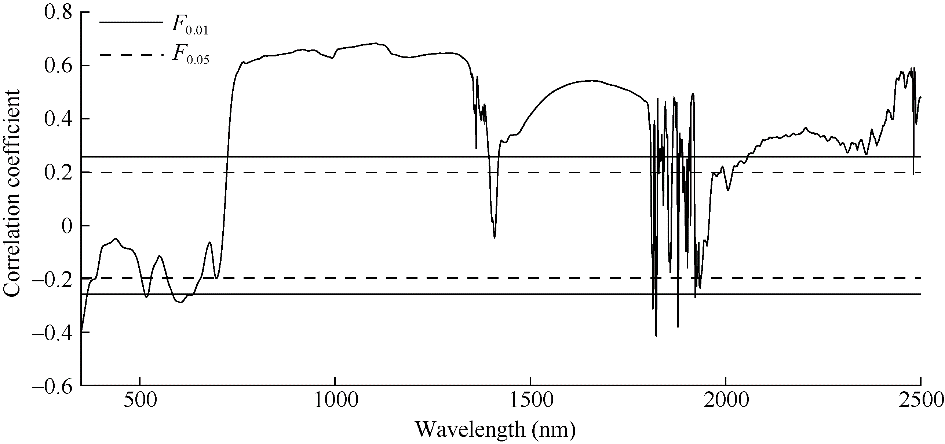
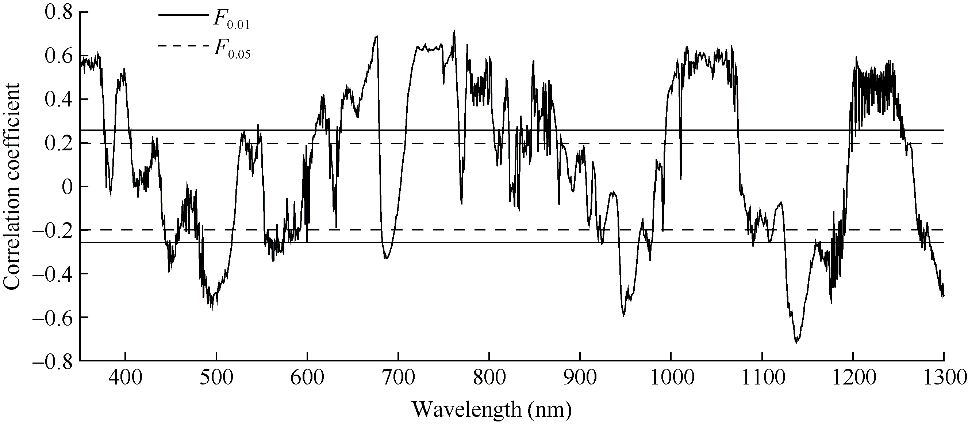
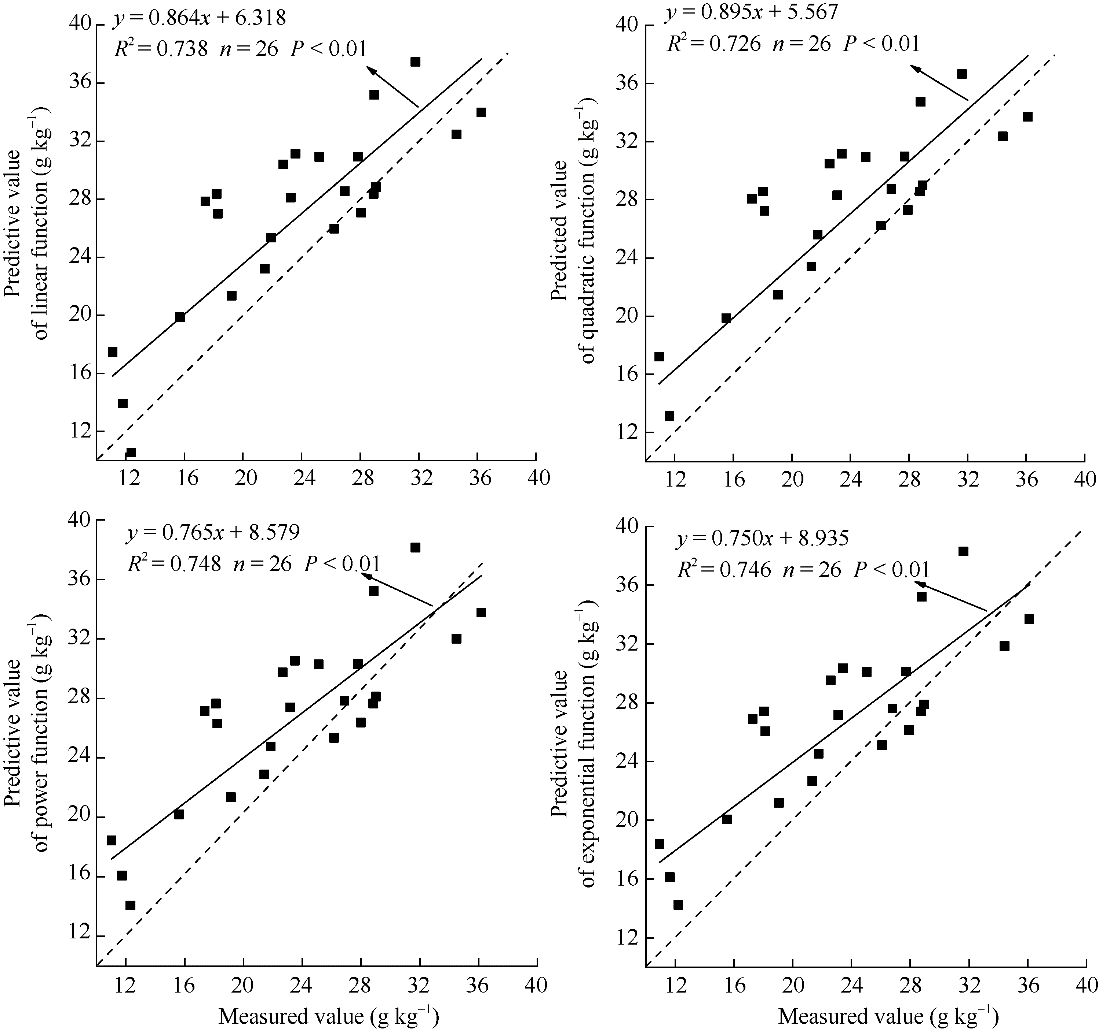
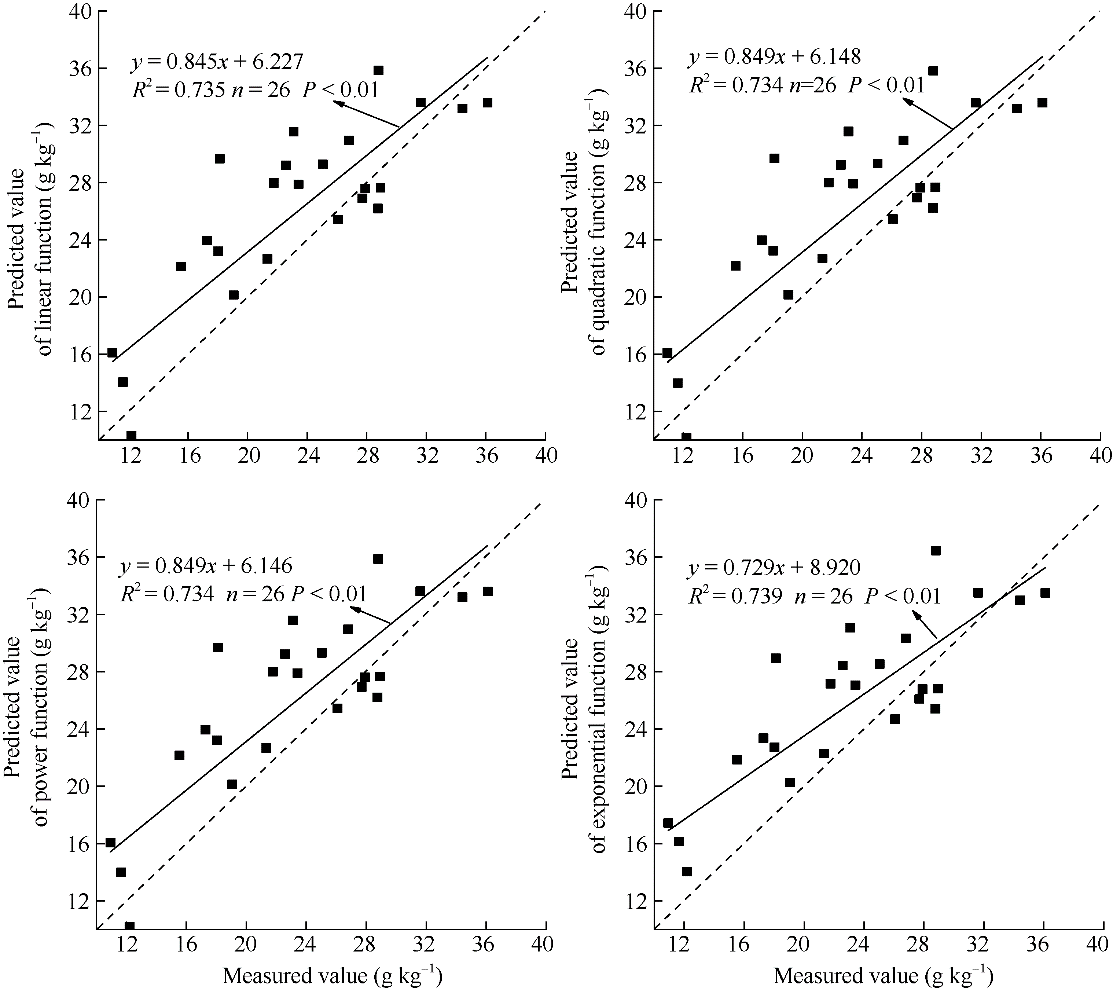
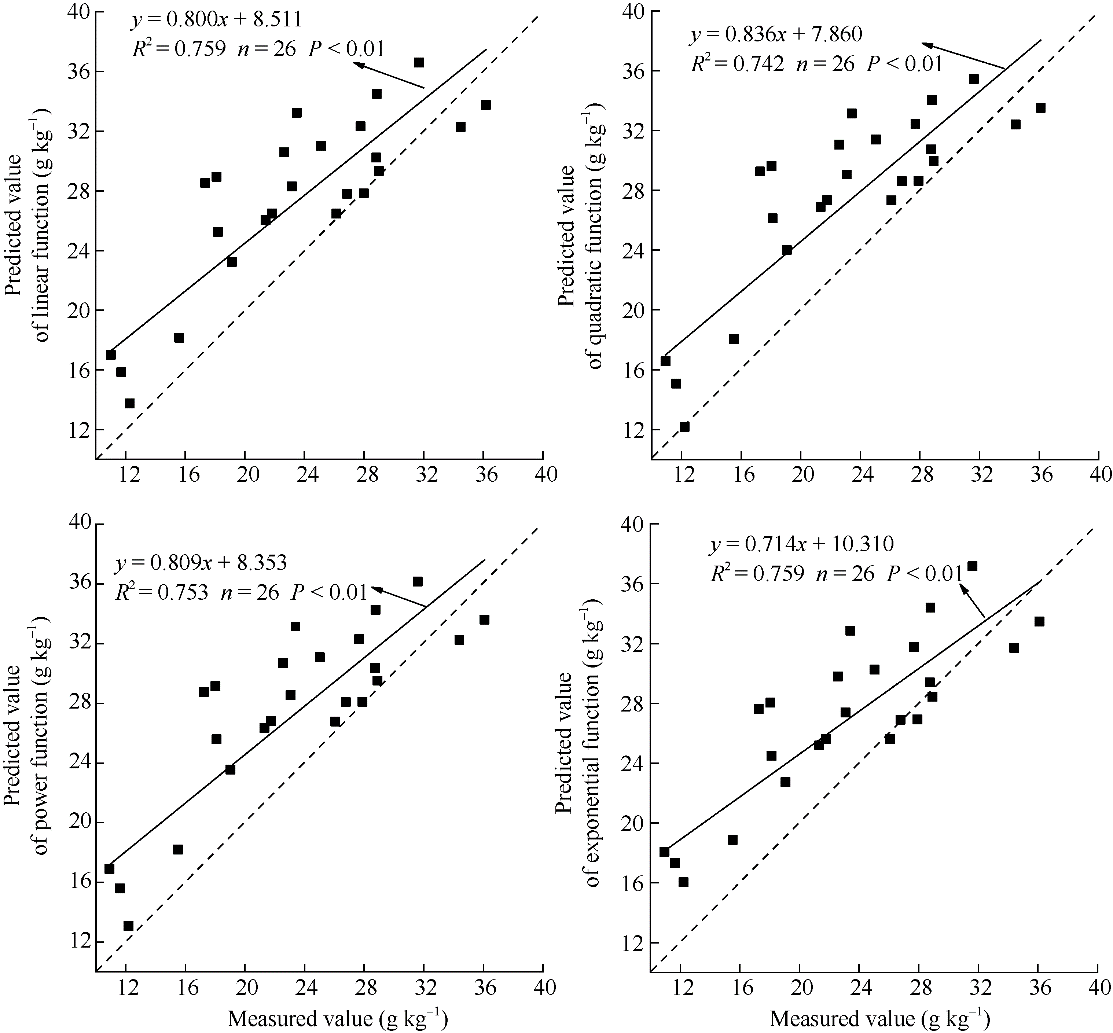
本文旨在明确甜菜叶片全氮含量与高光谱地面植被遥感的定量关系, 建立干旱区甜菜叶片全氮含量精确估测模型, 及时监测甜菜生长状况。本研究选取新疆滴灌甜菜(Beta356)为材料, 利用ASD野外高光谱仪在甜菜叶丛快速生长期、块根膨大期与糖分积累期采集各处理反射光谱, 并同时测定全氮含量, 分析原始光谱反射率及一阶微分光谱反射率与全氮含量的相关性, 并进一步建立光谱特征参数与敏感波段植被指数全氮含量估算模型。结果表明, 光谱特征参数Dr762幂函数下估算模型具有较好估算甜菜叶片全氮含量的能力, 其决定系数R 2 = 0.747, 验证相对误差RE(%)为21.635, 验证均方根误差RMSE为4.914; 通过植被指数与叶片全氮含量建立多种函数估测模型, 其中差值植被指数Dr762-Dr496下一元线性函数具有较好估算甜菜叶片全氮含量的能力, 其决定系数R 2 = 0.794, 验证相对误差RE(%)为23.008, 验证均方根误差为5.372。
| [1] | Lee Y J, Yang C M, Chang K W, Shen Y . A simple spectral index using reflectance of 735 nm to assess nitrogen status of rice canopy. Agron J, 2008,100:205-212. |
| [2] | 苏继霞, 王开勇, 费聪, 李阳阳, 樊华 . 氮肥运筹对滴灌甜菜产量、氮素吸收和氮素平衡的影响. 土壤通报, 2016,47:1404-1407. |
| Su J X, Wang K Y, Fei C, Li Y Y, Fan H . Effects of nitrogen management on sugar beet yield, Nitrogen uptake and soil nitrogen balance under drip irrigation. Chin J Soil Sci, 2016,47:1404-1407 (in Chinese with English abstract). | |
| [3] | 费聪, 王维成, 李阳阳, 樊华 . 氮素运筹对滴灌甜菜叶片光合特性的影响. 江苏农业科学, 2016,44(12):227-229. |
| Fei C, Wang W C, Li Y Y, Fan H . Effects of nitrogen management on photosynthetic characteristics of sugarbeet leaves under drip irrigation. Jiangsu Agric Sci, 2016,44(12):227-229 (in Chinese). | |
| [4] | 高雨茜 . 夏玉米叶绿素、叶面积指数高光谱估测研究. 西北农林科技大学硕士学位论文, 陕西杨凌, 2016. |
| Gao Y Q . Chlorophyll and Leaf Area Indexstimation Based on Hyperspectrum of Summer Corn. MS Thesis of Northwest A&F University, Yangling, Shaanxi, China, 2016 (in Chinese with English abstract). | |
| [5] | 刘冰峰 . 夏玉米不同生育时期生理生态参数的高光谱遥感监测模型. 西北农林科技大学博士学位论文, 陕西杨凌, 2016. |
| Liu B F . Monitoring Models of Physiological and Ecological Parameters of Summer Maize Based on Hyperspectral Remote Sensing at Different Growth Stages. PhD Dissertation of Northwest A&F University, Yangling, Shaanxi, China, 2016 (in Chinese with English abstract). | |
| [6] | Shibayama M, Akiyama T . Seasonal visible, near-infra-red and mid-infrared spectra of rice canopies in relation to LAI and above-ground dry biomass. Remote Sense Environ, 1989,27:119-127. |
| [7] | Smith M L, Ollinger S V, Martin M E, Aber J D, Hallett R A, Goodale C L . Direct estimation of aboveground forest productivity through hyperspectral remote sensing of canopy nitrogen. Ecol Appl, 2002,12:1286-1302. |
| [8] | Stone M L, Soile J B, Raun R . Use of spectral radiance for correcting in-season fertilizer nitrogen deficiencies in winter wheat. Trans ASAE, 1996,39:1623-1631. |
| [9] | Thomas J R, Oerther G F . Estimating nitrogen content of sweet pepper leaves by reflectance measurements. Agron J, 1972,64:11-13. |
| [10] | Tian Y C, Yao X, Yang J, Cao W X, Hannaway D B, Zhu Y . Assessing newly developed and published vegetation indices for estimating rice leaf nitrogen concentration with ground and spacebased hyperspectral reflectance. Field Crops Res, 2011,120:299-310. |
| [11] | Wang W, Yao X, Yao X F, Tian Y C, Liu X J, Ni J, Cao W X, Zhu Y . Estimating leaf nitrogen concentration with three-band vegetation indices in rice and wheat. Field Crops Res, 2012,129:90-98. |
| [12] | Menesatti P, Antonucci F, Pallottino F, Roccuzzo M, Allegra M, Stagno F, Intrigliolo F . Estimation of plant nutritional status by Vis-NIR spectrophotometric analysis on orange leaves. Biosyst Eng, 2010,105:448-454. |
| [13] | Zhang G C, Li Z, Yan X M, Cheng C G, Zhou P, Lin G L, Zhou C J, Liu N, Han X R . Rapid analysis of apple leaf nitrogen using near infrared spectroscopy and multiple linear regression. Commun Soil Sci Plant Anal, 2012,43:1768-1772. |
| [14] | 张潇元, 张立福, 张霞, 王树东, 田静国, 翟涌光 . 不同光谱植被指数反演冬小麦叶氮含量的敏感性研究. 中国农业科学, 2017,50:474-485. |
| Zhang X Y, Zhang L F, Zhang X, Wang S D, Tian J G, Zhai Y G . Sensitivity of different spectral vegetation index for estimating winter wheat leaf nitrogen. Sci Agric Sin, 2017,50:474-485 (in Chinese with English abstract). | |
| [15] | 王仁红, 宋晓宇, 李振海, 杨贵军, 郭文善, 谭昌伟, 陈立平 . 基于高光谱冬小麦氮素营养指数估测. 农业工程学报, 2014,30(19):191-198. |
| Wang R H, Song X Y, Li Z H, Yang G J, Guo W S, Tan C W, Chen L P . Estimation of winter wheat nitrogen nutrition index using hyperspectral remote sensing. Trans CSAE, 2014,30(19):191-198 (in Chinese with English abstract). | |
| [16] | 田永超, 杨杰, 姚霞, 朱艳, 曹卫星 . 利用红边面积形状参数估测水稻叶层氮浓度. 植物生态学报, 2009,33:791-801. |
| Tian Y C, Yang J, Yao X, Zhu Y, Cao W X . Estimation of leaf canopy nitrogen concentration with red edge area shape parameter in rice. Chin J Plant Ecol, 2009,33:791-801 (in Chinese with English abstract). | |
| [17] | 顾清, 邓劲松, 陆超, 石媛媛, 王珂, 沈掌门 . 基于光谱和形状特征的水稻扫描叶片氮素营养诊断. 农业机械学报, 2012,43(8):170-174. |
| Gu Q, Deng J X, Lu C, Shi Y Y, Wang K, Shen Z M . Diagnosis of rice nitrogen nutrition based on spectral and shape characteristics of scanning leaves. Trans CSAM, 2012,43(8):170-174 (in Chinese with English abstract). | |
| [18] | 黄春燕, 王登伟, 闫杰, 张煜星, 曹连莆, 程诚 . 棉花叶绿素密度和叶片氮积累量的高光谱监测研究. 作物学报, 2007,33:931-936. |
| Huang C Y, Wang D W, Yan J, Zhang Y X, Cao L P, Cheng C . Monitoring of cotton canopy chlorophyll density and leaf nitrogen accumulation status by using hyperspectral data. Acta Agron Sin, 2007,33:931-936 (in Chinese with English abstract). | |
| [19] | 吴华兵, 朱艳, 田永超, 姚霞, 刘晓军, 周治国, 曹卫星 . 棉花冠层高光谱参数与叶片氮含量的定量关系. 植物生态学报, 2007,31:903-909. |
| Wu H B, Zhu Y, Tian Y C, Yao X, Liu X J, Zhou Z G, Cao W X . Relationship between canopy hyperspectra parameter and leaf nitrogen concentration in cotton. Chin J Plant Ecol, 2007,31:903-909 (in Chinese with English abstract). | |
| [20] | 赵春江, 黄文江, 王纪华, 杨敏华, 薛绪掌 . 不同品种、肥水条件下冬小麦光谱红边参数研究. 中国农业科学, 2002,35:980-987. |
| Zhao C J, Huang W J, Wang J H, Yang M H, Xue X Z . Studies on the red edge parameters of spectrum in winter wheat under different varieties, Fertilizer and water treatments. Sci Agric Sin, 2002,35:980-987 (in Chinese with English abstract). | |
| [21] | 王树文, 赵越, 王丽凤, 王润涛, 宋玉柱, 张长利, 苏中滨 . 基于高光谱的寒地水稻叶片氮素含量预测. 农业工程学报, 2016,32(20):187-194. |
| Wang S W, Zhao Y, Wang L F, Wang R T, Song Y Z, Zhang C L, Su Z B . Prediction for nitrogen content of rice leaves in cold region based on hyperspectrum. Trans CSAE, 2016,32(20):187-194 (in Chinese with English abstract). | |
| [22] | 陈兵, 王方永, 韩焕勇, 刘政, 邓福军, 林海, 余渝, 李少昆, 王克如, 肖春华 . 基于光谱红边参数的棉花黄萎病叶片氮素含量诊断研究. 棉花学报, 2013,25:254-261. |
| Chen B, Wang F Y, Han H Y, Liu Z, Deng F J, Lin H, Yu Y, Li S K, Wang K R, Xiao C H . Monitoring nitrogen contents in leaves of cotton under verticillium wilt stress based on spectra red-edge parameters. Cotton Sci, 2013,25:254-261 (in Chinese with English abstract). | |
| [23] | Yao X, Zhu Y, Tian Y C, Cao W X . Exploring hyperspectral bands and estimation indices for leaf nitrogen accumulation in wheat. Int J Appl Earth Obs, 2010,12:89-100. |
| [24] | Rouse J W, Haas R H, Schell J A, Deering D W . Monitoring vegetation systems in the Great Plains with ERTS. NASA SP, 1974,351:309. |
| [25] | 梁亮, 杨敏华, 邓凯东, 张连蓬, 林卉, 刘志霄 . 一种估测小麦冠层氮含量的新高光谱指数. 生态学报, 2011,31:6594-6605. |
| Liang L, Yang M H, Deng K D, Zhang L P, Lin H, Liu Z X . A new hyperspectral index for the estimation of nitrogen contents of wheat canopy. Acta Ecol Sin, 2011,31:6594-6605 (in Chinese with English abstract). | |
| [26] | Gitelson A A, Merzlyak M N . Spectral reflectance changes associated with autumn senescence of Aesculus hippocastanum L. and Acer platanoides L. leaves. Spectral features and relation to chlorophyll estimation. J Plant Physiol, 1994,143:286-292. |
| [27] | Daniel A S, John A G . Relationships between leaf pigment content and spectral reflectance across a wide range of species, leaf structures and developmental stages. Remote Sense Environ, 2008,81:337-354. |
| [28] | Gitelson A A, Merzlyak M N . Signature analysis of leaf reflectance spectra: algorithm development for remote sensing of chlorophyll. J Plant Physiol, 1996,148:494-500. |
| [29] | Huete A R . A soil-adjusted vegetation index (SAVI). Remote Sense Environ, 1988,25:295-309. |
| [30] | Rondeaux G, Steven M, Baret F . Optimization of soil-adjusted vegetation indices. Remote Sense Environ, 1996,55:95-107. |
| [31] | Haboudane D, Miller J R, Pattey E, Zarco P J, Strachan I B . Hyperspectral vegetation indices and novel algorithms for predicting green LAI of crop canopy: monitoring and validation in the context of precision agriculture. Remote Sense Environ, 2004,90:337-352. |
| [32] | Chen P F, Haboudane D, Trembley N, Wang J H, Vigneault P, Li B G . New spectral indicator assessing the efficiency of crop nitrogen treatment in corn and wheat, Remote Sense Environ, 2010,114:1987-1997. |
| [33] | Gitelson A A, Vina A, Ciganda V, Rundquist D C, Arkebauer T J . Remote estimation of canopy chlorophyll content in crops. Geophys Res Lett, 2005,32:1-4. |
| [34] | Serrano L, Penuelas J, Ustin S L . Remote sensing of nitrogen and lignin in Mediterranean vegetation decomposing biochemical from structural signals. Remote Sense Environ, 2002,81:355-364. |
| [35] | Broge N H, Leblanc E . Comparing prediction power and stability of broadband and hyperspectral vegetation indices for estimation of green leaf area index and canopy chlorophyll density. Remote Sense Environ, 2001,76:156-172. |
| [36] | 谌俊旭, 黄山, 范元芳, 王锐, 刘沁林, 杨文钰, 杨峰 . 单作套作大豆叶片氮素积累与光谱特征. 作物学报, 2017,43:1835-1844. |
| Chen J X, Huang S, Fan Y F, Wang R, Liu Q L, Yang W Y, Yang F . Remote detection of canopy leaf nitrogen status in soybean by hyperspectral data under monoculture and intercropping systems. Acta Agron Sin, 2017,43:1835-1844 (in Chinese with English abstract). | |
| [37] | 杨福芹, 冯海宽, 李振海, 杨贵军, 戴华阳 . 基于可见光-近红外光谱特征参数的苹果叶片氮含量预测. 农业机械学报, 2017,48(9):143-151. |
| Yang F Q, Feng H K, Li Z H, Yang G J, Dai H Y . Prediction for nitrogen content of apple leaves using spectral features parameters from visible and near infrared lights. Trans CSAM, 2017,48(9):143-151 (in Chinese with English abstract). | |
| [38] | 徐道青, 刘小玲, 王维, 陈敏, 阚画春, 李常凤, 郑曙峰 . 淹水胁迫下棉花叶片高光谱特征及叶绿素含量估算模型. 应用生态学报, 2017,28:3289-3296. |
| Xu D Q, Liu X L, Wang W, Chen M, Kan H C, Li C F, Zheng S F . Hyper-spectral characteristics and estimation model of leaf chlorophyll content in cotton under waterlogging stres. Chin J Appl Ecol, 2017,28:3289-3296 (in Chinese with English abstract). | |
| [39] | Knyazikhin Y, Mitchell A, Schull, Stenberg P, Mottus M, Rautiaien M, Yang Y, Marshak A, Carmona P L, Kaufmann R K, Lewis P, Disney M I, Vanderbilt V, Davis A B, Baret F, Jacquemoud S J, Lyapustin A, Myneni R B . Hyperspectral remote sensing of foliar nitrogen content. Proc Natl Acad Sci USA, 2013,110:E185-E192. |
| [40] | Ollinger S V, Reich P B, Frolking S, Lepine L C, Hollinger D Y, Richardson A D . Nitrogen cycling, forest canopy reflectance, and emergent properties of ecosystems. Proc Natl Acad Sci USA, 2013,110:E2437. |
| [41] | Townsen P A, Serbin S P, Kruger E L, Gamon J A . Disentangling the contribution of biological and physical properties of leaves and canopies in imaging spectroscopy data. Proc Natl Acad Sci USA, 2013,110:E1704. |
| [42] | Ustin S L . Remote sensing of canopy chemistry. Proc Natl Acad Sci USA, 2013,110:804-805. |
| [1] | 李金敏, 陈秀青, 杨琦, 史良胜. 基于高光谱的水稻叶片氮含量估计的深度森林模型研究[J]. 作物学报, 2021, 47(7): 1342-1350. |
| [2] | 李艳大, 曹中盛, 舒时富, 孙滨峰, 叶春, 黄俊宝, 朱艳, 田永超. 基于作物生长监测诊断仪的双季稻叶干重监测模型[J]. 作物学报, 2021, 47(10): 2028-2035. |
| [3] | 吾木提·艾山江,买买提·沙吾提,陈水森,李丹. 基于GF-1/2卫星数据的冬小麦叶面积指数反演[J]. 作物学报, 2020, 46(5): 787-797. |
| [4] | 吴亚鹏,贺利,王洋洋,刘北城,王永华,郭天财,冯伟. 冬小麦生物量及氮积累量的植被指数动态模型研究[J]. 作物学报, 2019, 45(8): 1238-1249. |
| [5] | 李艳霞,杨卫兵,尹燕枰,郑孟静,陈金,杨东清,骆永丽,庞党伟,李勇,王振林. 小麦小穗不同粒位粒重形成的生理特性差异[J]. 作物学报, 2019, 45(11): 1715-1724. |
| [6] | 依尔夏提•阿不来提,买买提•沙吾提,白灯莎•买买提艾力,安申群,马春玥. 基于随机森林法的棉花叶片叶绿素含量估算[J]. 作物学报, 2019, 45(1): 81-90. |
| [7] | 王利民,杨玲波,刘佳,杨福刚,姚保民. GF-1和MODIS影像冬小麦长势监测指标NDVI的对比[J]. 作物学报, 2018, 44(7): 1043-1054. |
| [8] | 高林,杨贵军,李长春,冯海宽,徐波,王磊,董锦绘,付奎. 基于光谱特征与PLSR结合的叶面积指数拟合方法的无人机画幅高光谱遥感应用[J]. 作物学报, 2017, 43(04): 549-557. |
| [9] | 齐波,张宁, 赵团结,邢光南,赵晋铭*,盖钧镒. 利用高光谱技术估测大豆育种材料的叶面积指数[J]. 作物学报, 2015, 41(07): 1073-1085. |
| [10] | 张宁, 齐波,赵晋铭,张小燕,王素阁,赵团结,盖钧镒. 应用主动传感器GreenSeeker估测大豆籽粒产量[J]. 作物学报, 2014, 40(04): 657-666. |
| [11] | 冯伟,王晓宇,宋晓,贺利,王永华,郭天财. 基于冠层反射光谱的小麦白粉病严重度估测[J]. 作物学报, 2013, 39(08): 1469-1477. |
| [12] | 赵姣,郑志芳,方艳茹,周顺利,廖树华,王璞. 基于动态模拟模型分析冬小麦干物质积累特征对产量的影响[J]. 作物学报, 2013, 39(02): 300-308. |
| [13] | 吴琼,齐波,赵团结,姚鑫锋,朱艳,盖钧镒. 高光谱遥感估测大豆冠层生长和籽粒产量的探讨[J]. 作物学报, 2013, 39(02): 309-318. |
| [14] | 陈兵,韩焕勇,王方永,刘政,邓福军,林海,余渝,李少昆,王克如,肖春华. 利用光谱红边参数监测黄萎病棉叶叶绿素和氮素含量[J]. 作物学报, 2013, 39(02): 319-329. |
| [15] | 王磊,白由路,卢艳丽,王贺,杨俐苹. 基于GreenSeeker的冬小麦NDVI分析与产量估算[J]. 作物学报, 2012, 38(04): 747-753. |
|
||