利用GGE双标图划分长江流域棉花纤维品质生态区
 , 李健
, 李健 Ecological Regionalization of Cotton Fiber Quality Based on GGE Biplot in Yangtze River Valley
XU Nai-Yin, LI Jian
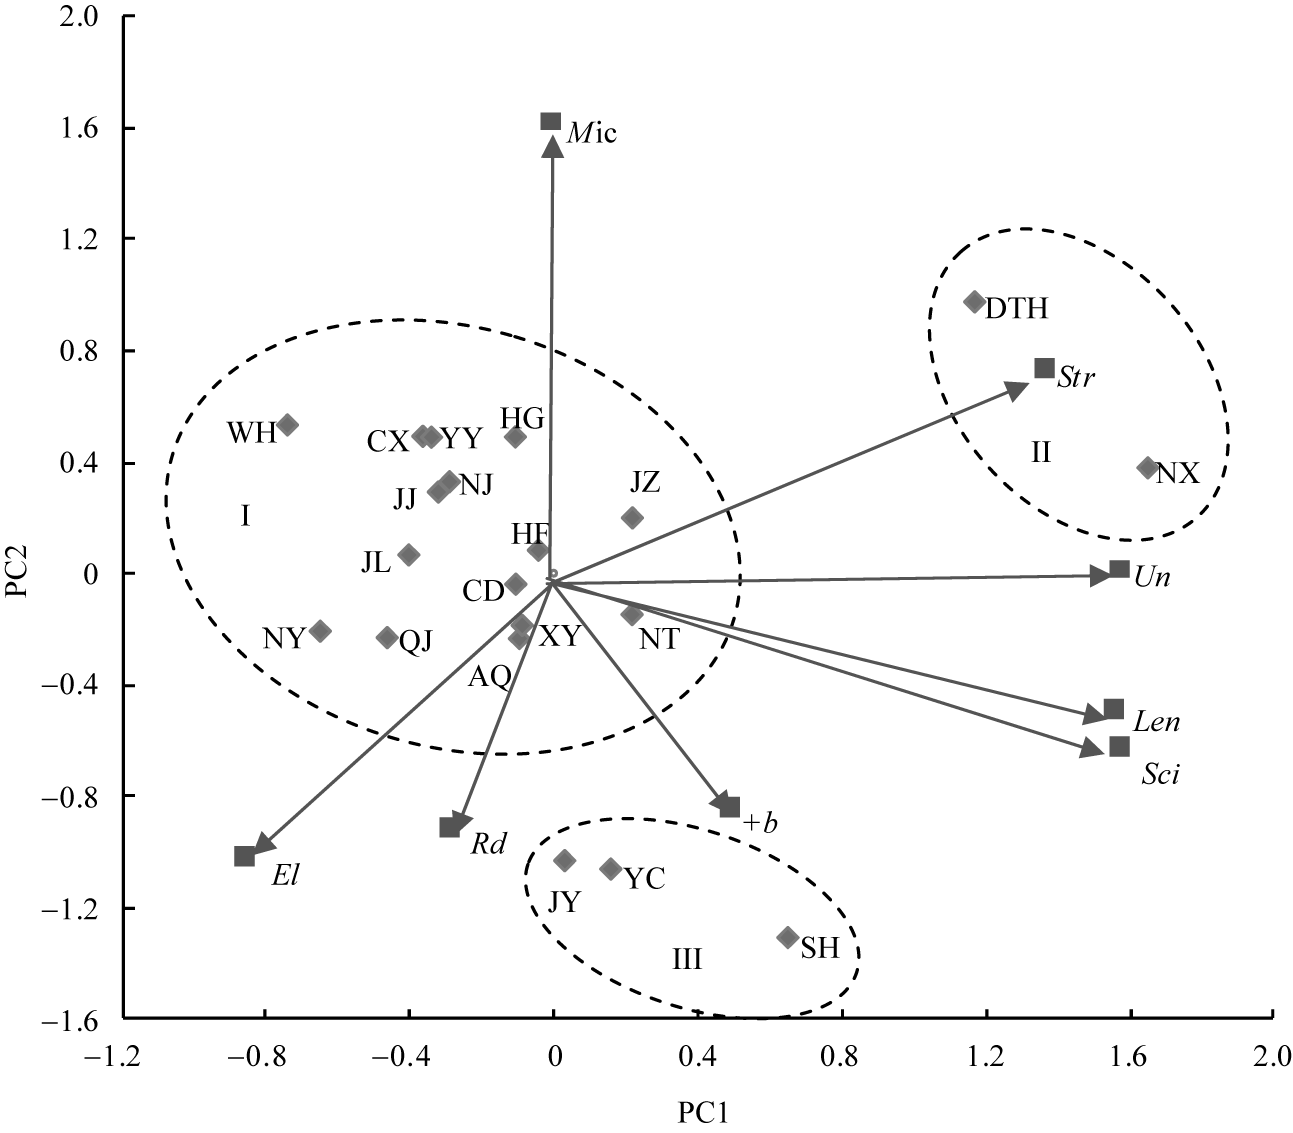
, LI Jian Fig. 1 GGE biplot analysis of ecological regionalization pattern based on cotton fiber quality characteristics in YaRV from 2000 to 2012 The biplot was based on environment-centered Centering = 2 and standard deviation scaled Scaling = 1 enrionments and fiber traits two way datasets, using environment-focused singular value portioning SVP = 2 method. Len , Str , Mic , El , Rd , +b , Un , and Sci in italics stand for fiber length, fiber strength, micronaire value, elongation, reflectance, yellowness, uniformity index and spinning consistency index, respectively. Symbols in regular upcase stand for test environment codes around the dotted ellipsesas which correspond with the codes given in Table 1, which are members of the same group at the three levels in Fig.2. I, II, and III stand for the three ecological regions, respectively. PC1 = 43.7%, PC2 = 27.0%, Sum = 70.7%; Transformation = 0, Scaling = 1, Centering = 2, SVP = 2.