大豆生物量与产量组分间的相关及关联分析
 , 郝德荣
, 郝德荣 Correlation and Association Analysis between Biomass and Yield Components in Soybean
CHAO Mao-Ni1, ** , HAO De-Rong2, ** , YIN Zhi-Tong3 , ZHANG Jin-Yu1 , SONG Hai-Na1 , ZHANG Huai-Ren1 , CHU Shan-Shan1 , ZHANG Guo-Zheng1 , YU De-Yue1, *
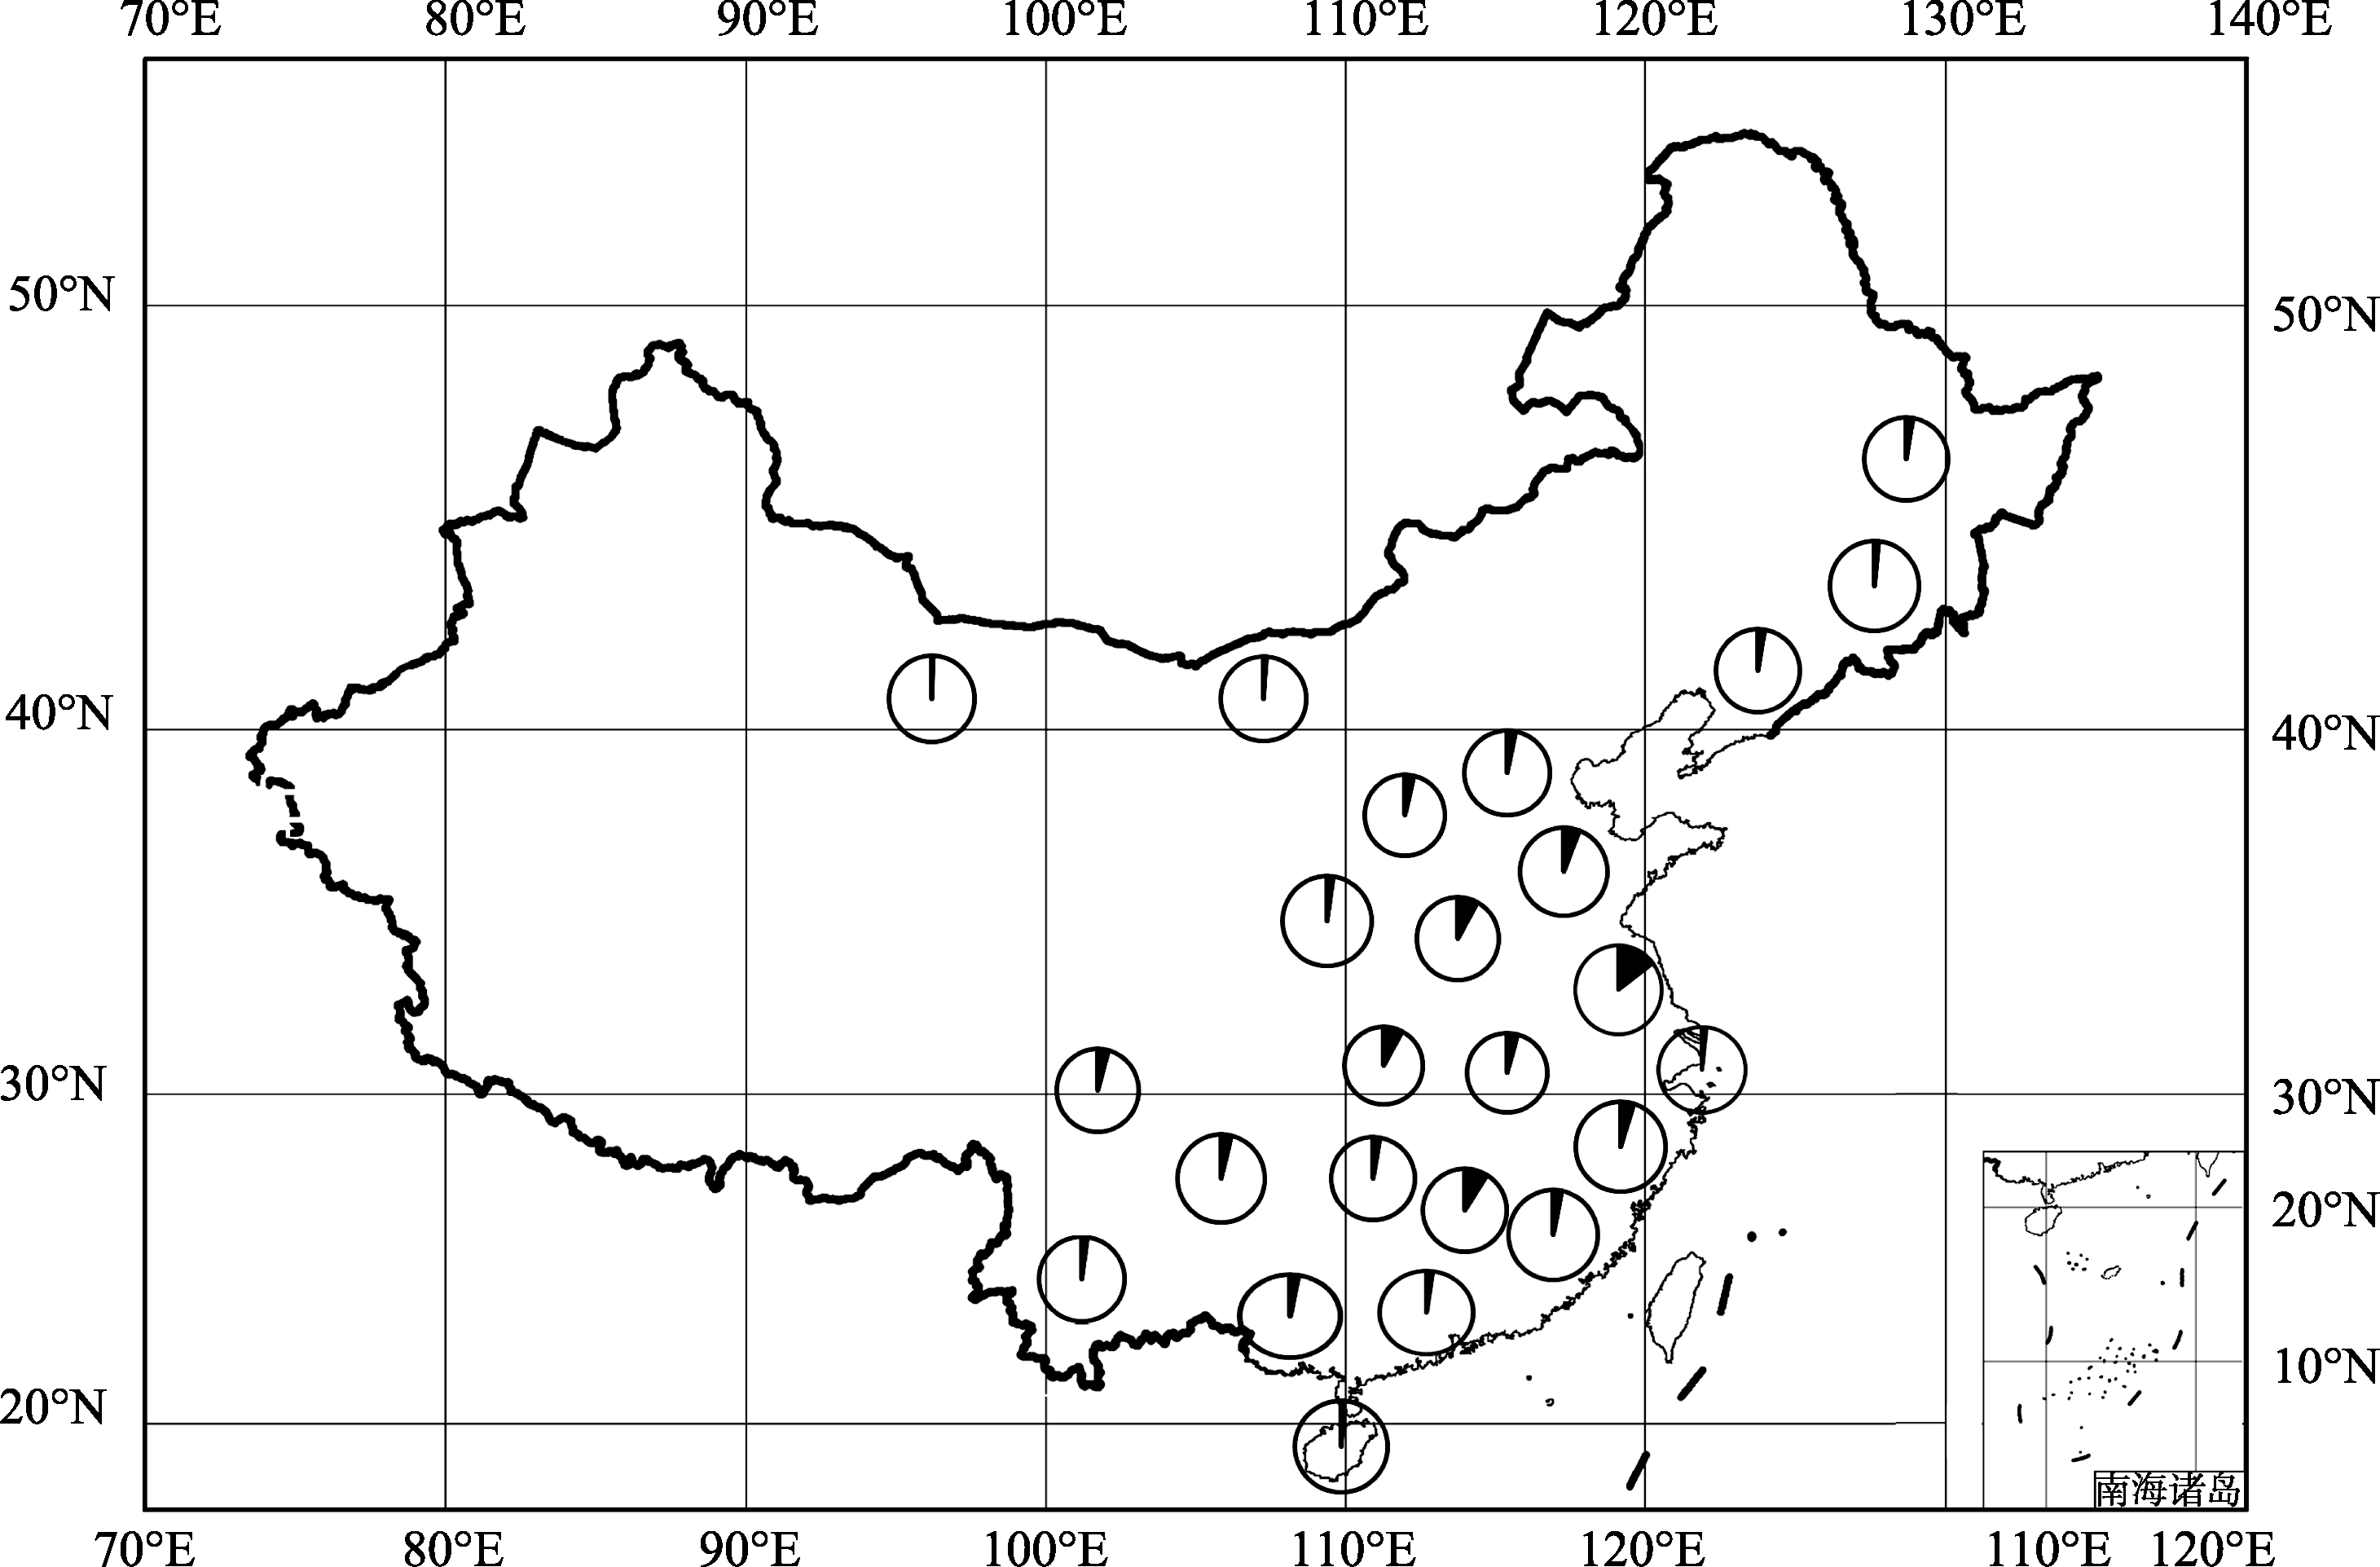
, HAO De-Rong Fig. 1 Geographical distribution of 191 soybean landraces in our study Circles represent different provinces, the number of soybean landraces per province is indicated by closed portion of the circle.