基于无人机多光谱数据和氮素空间分异的玉米冠层氮浓度估算
Estimation of canopy nitrogen concentration in maize based on UAV multi- spectral data and spatial nitrogen heterogeneity
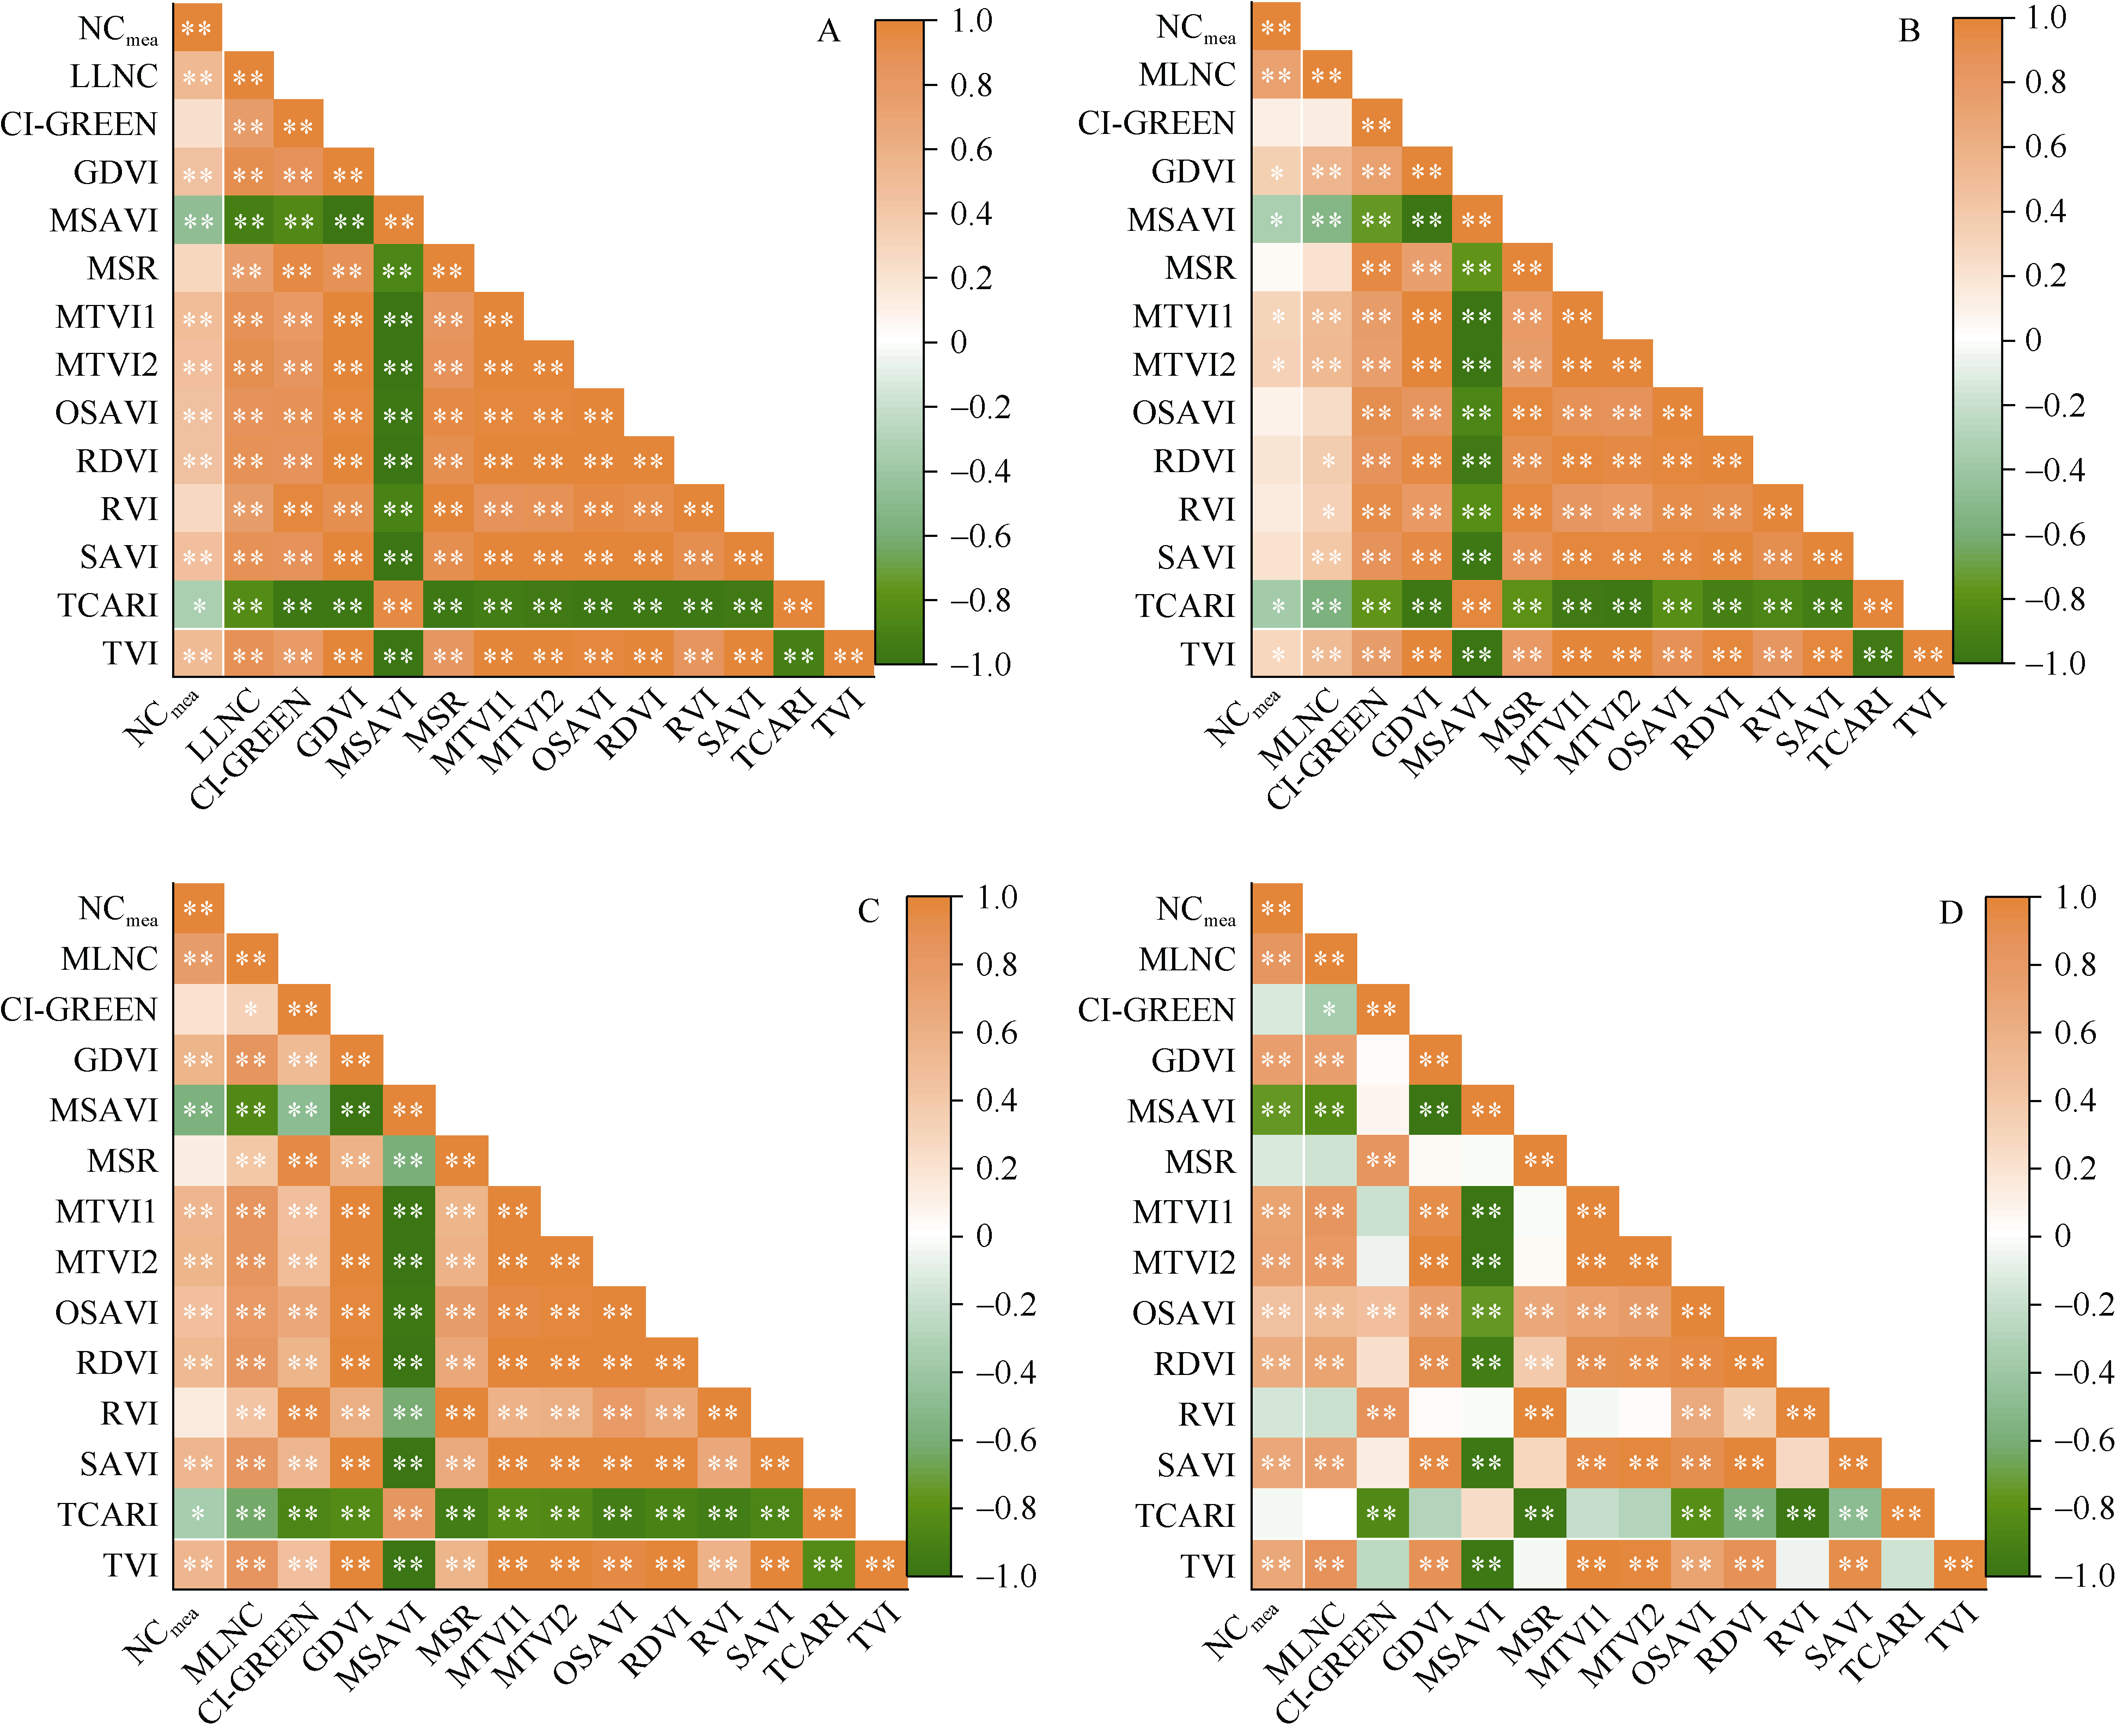
NCmea、MLNC和LLNC分别代表实测冠层氮浓度、中层叶片氮浓度和下层叶片氮浓度; *和**分别表示在0.05和0.01概率水平显著相关。缩略词同
NCmea, MLNC, and LLNC represent measured canopy nitrogen concentration, middle leaf nitrogen concentration, and lower leaf nitrogen concentration, respectively. * and ** indicate significant correlation at P < 0.05 and P < 0.01, respectively. Abbreviations are the same as those given in