欢迎访问作物学报,今天是
作物学报 ›› 2020, Vol. 46 ›› Issue (7): 1099-1111.doi: 10.3724/SP.J.1006.2020.94134
古丽努尔·依沙克,买买提·沙吾提( ),马春玥
),马春玥
Gulnur ISAK,Mamat SAWUT(),MA Chun-Yue
摘要:
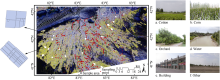
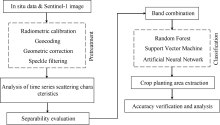
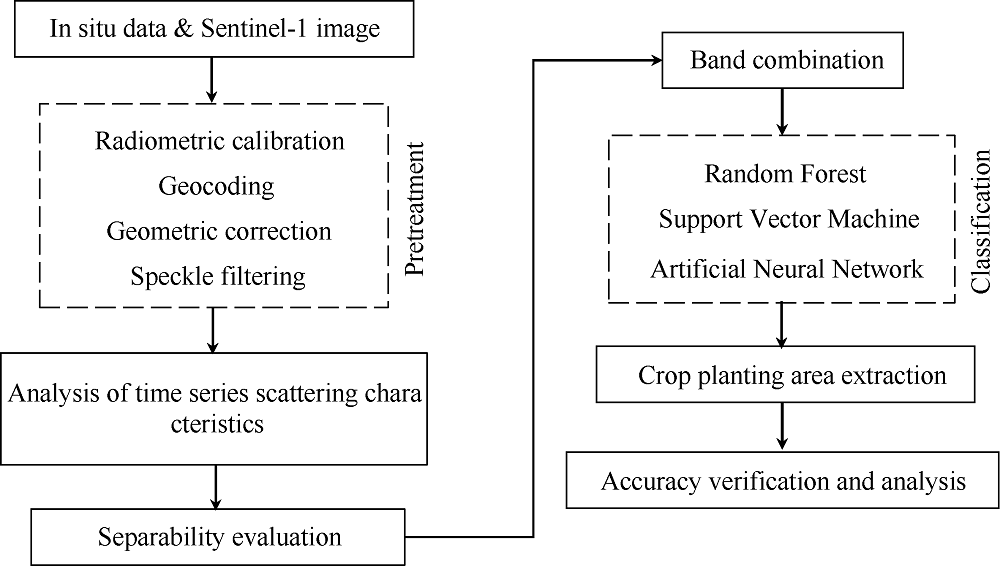
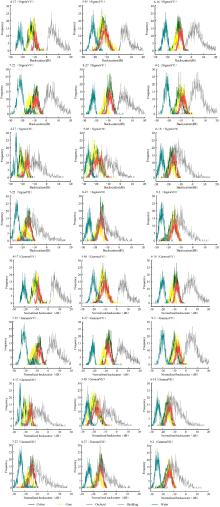
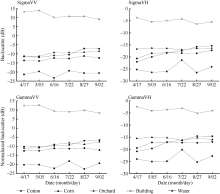
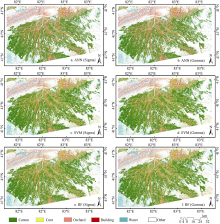
及时准确地获取农作物的空间分布信息和种植面积, 在农业生产管理与农业政策的制定等方面具有非常重要的作用。本文以多时相Sentinel-1A影像(4月17日、5月5日、6月16日、7月22日、8月27日、9月2日)为主要数据源, 根据研究区作物的物候特征, 提取棉花、玉米和果树在不同生长期的后向散射系数(Sigma)和归一化后向散射系数(Gamma)。通过对作物不同极化、不同时相后向散射系数的统计, 建立散射特征时序变化曲线, 并分析其特征。利用人工神经网络(Artificial neural network)、支持向量机(Support vector machine)和随机森林(Random forest) 3种分类方法对研究区的主要农作物进行分类识别以及种植面积提取, 并对分类结果对比分析和验证。结果表明, 1)棉花的后向散射系数在6月现蕾期和7月开花期明显上升, 8月份达最高值, 变化特征最明显, 易与其他作物区分; 玉米和果树的后向散射系数在9月份与其他地物之间表现出显著差异。2)相较于神经网络和支持向量机, 随机森林的分类效果最好, 总体精度达88.97%。其中, 对棉花和果园的分类精度为90.88%和93.17%, 对玉米的分类效果最差, 仅有71.6%。综上所述, 多时相双极化SAR数据在不同类型作物的识别及面积提取方面具有一定的应用潜力。
| [1] | 杨邦杰, 裴志远. 农作物长势的定义与遥感监测. 农业工程学报, 1999,15(3):214-218. |
| Yang B J, Pei Z Y. Definition of crop condition and crop monitoring using remote sensing. Trans CSAE, 1999,15(3):214-218 (in Chinese with English abstract). | |
| [2] | 陈仲新, 任建强, 唐华俊, 史云, 冷佩, 刘佳, 王利民, 吴文斌, 姚艳敏, 哈斯图亚. 农业遥感研究应用进展与展望. 遥感学报, 2016,20:748-767. |
| Chen Z X, Ren J Q, Tang H J, Shi Y, Leng P, Liu J, Wang L M, Wu W B, Yao Y M, Hasituya. Progress and perspectives on agricultural remote sensing research and applications in China. J Remote Sens, 2016,20:748-767 (in Chinese with English abstract). | |
| [3] | 郭交, 朱琳, 靳标. 基于Sentinel-1和Sentinel-2数据融合的农作物分类. 农业机械学报, 2018,49(4):192-198. |
| Guo J, Zhu L, Jin B. Crop classification based on data fusion of Sentinel-1 and Sentinel-2. Trans CSAM, 2018,49(4):192-198 (in Chinese with English abstract). | |
| [4] | 周涛, 潘剑君, 韩涛, 魏善宝. 基于多时相合成孔径雷达与光学影像的冬小麦种植面积提取. 农业工程学报, 2017,33(10):215-221. |
| Zhou T, Pan J J, Han T, Wei S B. Planting area extraction of winter wheat based on multi-temporal SAR data and optical imagery. Trans CSAE, 2017,33(10):215-221 (in Chinese with English abstract). | |
| [5] | 王利民, 刘佳, 杨福刚, 杨玲波, 姚保民, 王小龙. 基于GF-1卫星遥感数据识别京津冀冬小麦面积. 作物学报, 2018,44:762-773. |
| Wang L M, Liu J, Yang F G, Yang L B, Yao B M, Wang X L. Acguisition of Winter Wheat Area in the Beijing-Tianjin-Hebei Region with GF-1 Satellite Data. Acta Agron Sin, 2018,44:762-773. | |
| [6] | 王迪, 周清波, 陈仲新, 刘佳. 基于合成孔径雷达的农作物识别研究进展. 农业工程学报, 2014,30(16):203-212. |
| Wang D, Zhou Q B, Chen Z X, Liu J. Research advances on crop identification using synthetic aperture radar. Trans CSAE, 2014,30(16):203-212 (in Chinese with English abstract). | |
| [7] | 王松寒, 何隆华. 雷达遥感技术在水稻识别中的研究进展. 遥感信息, 2015,30(2):3-9. |
| Wang S H, He L H. Advances of rice recognition by SAR. Remote Sens Inf, 2015,30(2):3-9 (in Chinese with English abstract). | |
| [8] | 张庆君, 韩晓磊, 刘杰. 星载合成孔径雷达遥感技术进展及发展趋势. 航天器工程, 2017,26(6):1-8. |
| Zhang Q J, Han X L, Liu J. Technology progress and development trend of space borne synthetic aperture radar remote sensing. Spacecraft Engineer, 2017,26(6):1-8 (in Chinese with English abstract). | |
| [9] |
Marco P, Alexander B. Assessing fruit-tree crop classification from Landsat-8 time series for the Maipo Valley, Chile. Remote Sens Environ, 2015,171:234-244.
doi: 10.1016/j.rse.2015.10.029 |
| [10] |
Alexandre B, Thuy L T, Nguyen D L. Monitoring of the rice cropping system in the Mekong Delta using ENVISAT/ASAR dual polarization data. IEEE Trans Geosci Remote Sens, 2009,47:517-526.
doi: 10.1109/TGRS.2008.2007963 |
| [11] | Ling F L, Li Z Y, Bai L N, Tian X, Chen E X, Yang Y T. Rice mapping using ALOS PALSAR dual polarization data. J Remote Sens, 2011,15:1215-1227. |
| [12] |
Loosvelt L, Peters J, Skriver H, Baets B D, Verhoest N. Impact of reducing polarimetric SAR input on the uncertainty of crop classifications based on the random forests algorithm. IEEE Trans Geosci Remote Sens, 2012,50:4185-4200.
doi: 10.1109/TGRS.2012.2189012 |
| [13] |
Zhou Y N, Luo J C, Feng L, Yang Y P, Chen Y H, Wu W. Long-short-term-memory-based crop classification using high- resolution optical images and multi-temporal SAR data. GISci Remote Sens, 2019,56:1170-1191.
doi: 10.1080/15481603.2019.1628412 |
| [14] |
Villa P, Stroppiana D, Fontanelli G, Azar R, Alessandro P B. In-season mapping of crop type with optical and X-band SAR data: a classification tree approach using synoptic seasonal features. Remote Sens, 2015,7:12859-12886.
doi: 10.3390/rs71012859 |
| [15] |
李俐, 孔庆玲, 王鹏新, 王蕾, 荀兰. 基于时间序列Sentinel-1A数据的玉米种植面积监测研究. 资源科学, 2018,40:1608-1621.
doi: 10.18402/resci.2018.08.11 |
|
Li L, Kong Q L, Wang P X, Wang L, Xun L. Monitoring of maize planting area based on time-series Sentinel-1A SAR data. Resour Sci, 2018,40:1608-1621 (in Chinese with English abstract).
doi: 10.18402/resci.2018.08.11 |
|
| [16] |
Jia K, Li Q A, Tian Y C, Wu B F, Zhang F F, Meng J H. Crop classification using multi-configuration SAR data in the North China plain. Int J Remote Sens, 2012,33:170-183.
doi: 10.1080/01431161.2011.587844 |
| [17] | 郭交, 尉鹏亮, 周正舒, 苏宝峰. 基于时变特征的多时相PolSAR农作物分类方法. 农业机械学报, 2017,48(12):174-182. |
| Guo J, Wei P L, Zhou Z S, Su B F. Crop classification method with differential characteristics based on multi-temporal PolSAR Images. Trans CSAM, 2017,48(12):174-182 (in Chinese with English abstract). | |
| [18] | 东朝霞, 王迪, 周清波, 陈仲新, 刘佳. 基于SAR遥感的北方旱地秋收作物识别研究. 中国农业资源与区划, 2016,37(8):27-36. |
| Dong Z X, Wang D, Zhou Q B, Chen Z X, Liu J. Dryland crop identification based on synthetic aperture radar in the North China Plain. Chin J Agric Resour Regional Plan, 2016,37(8):27-36 (in Chinese with English abstract). | |
| [19] | 茹皮亚·西拉尔, 杨辽. 新疆棉花物候时空变化遥感监测及气温影响分析. 遥感技术与应用, 2018,33(5):151-159. |
| Rupiya X, Yang L. Monitoring spatial-temporal change of cotton phenology in Xinjiang and its response to climate change. Remote Sens Technol Appl, 2018,33(5):151-159 (in Chinese with English abstract). | |
| [20] |
杜伟娜, 徐爱功, 宋耀鑫, 孙华生. 新型SAR传感器一级地距产品绝对辐射定标方法. 国土资源遥感, 2016,28(4):30-34.
doi: 10.6046/gtzyyg.2016.04.05 |
|
Du W N, Xu A G, Song Y X, Sun H S. Absolute radiometric calibration of level-1 detected ground range products of new SAR sensors. Remote Sens Land Resour, 2016,28(4):30-34 (in Chinese with English abstract).
doi: 10.6046/gtzyyg.2016.04.05 |
|
| [21] |
Kumar P, Prasad R, Mishra V N, Gupta D K, Singh S K. Artificial neural network for crop classification using C-band RISAT-1 satellite datasets. Russ Agric Sci, 2016,42:281-284.
doi: 10.3103/S1068367416030137 |
| [22] | Vapnik V N. Statistical Learning Theory. New York: John Wiley, 1998. pp 421-445. |
| [23] |
Chapelle O, Haffner P, Vapnik V N. Support vector machines for histogram-based image classification. IEEE Trans Neural Netw, 1999,10:1055-1064.
doi: 10.1109/72.788646 pmid: 18252608 |
| [24] |
Leo B. Random forests. Mach Learn, 2001,45:5-32.
doi: 10.1023/A:1010933404324 |
| [25] | 化国强. 基于全极化SAR数据玉米长势监测及制图研究. 南京信息工程大学硕士学位论文, 江苏南京, 2011. |
| Hua G Q. Study on Maize Growth Monitoring and Maize Mapping Based on Full-Polarization SAR data. MS Thesis of Nanjing University of Information Engineering, Nanjing, Jiangsu, China, 2011 (in Chinese with English abstract). | |
| [26] | Richards J A, Jia X P. Remote Sensing Digital Image Analysis: An Introduction. Berlin: Springer Verlag, 2006. pp 250-273. |
| [27] | 王凯, 赵军, 朱国锋, 张佩云, 刘江涛, 陈栋栋. 基于GF-1遥感数据决策树与混合像元分解模型的冬小麦种植面积早期估算. 遥感技术与应用, 2018,33(1):158-167. |
| Wang K, Zhao J, Zhu G F, Zhang P Y, Liu J T, Chen D D. Early estimation of winter wheat planting area in Qingyang city by decision tree and pixel unmixing methods based on GF-1 satellite data. Remote Sens Technol Appl, 2018,33(1):158-167 (in Chinese with English abstract). | |
| [28] | 王安琪, 周德民, 宫辉力. 基于雷达后向散射特性进行湿地植被识别与分类的方法研究. 遥感信息, 2012, (2):15-19. |
| Wang Q A, Zhou D M, Gong H L. A research on method of wetland vegetation identification and classification based on radar backscatter characteristics. Remote Sens Inf, 2012, (2):15-19 (in Chinese with English abstract). | |
| [29] | 丁娅萍, 陈仲新. 基于最小距离法的RADARSAT-2遥感数据旱地作物识别. 中国农业资源与区划, 2014,35(6):79-84. |
| Ding Y P, Chen Z X. Dry land crop classification using minimum distance method based on RADARSAT- 2 data. Chin J Agric Resour Regional Plan, 2014,35(6):79-84 (in Chinese with English abstract). | |
| [30] | 郝卫平, 梅旭荣, 蔡学良, 杜建涛, 刘勤. 基于多时相遥感影像的东北三省作物分布信息提取. 农业工程学报, 2011,27(1):201-207. |
| Hao W P, Mei X R, Cai X L, Du J T, Liu Q. Crop planting extraction based on multi-temporal remote sensing data in Northeast China. Trans CSAE, 2011,27(1):201-207 (in Chinese with English abstract). | |
| [31] |
Zhang M W, Zhou Q B, Chen Z X, Liu J, Zhou Y, Cai C F. Crop discrimination in Northern China with double cropping systems using Fourier analysis of time-series MODIS data. Int J Appl Earth Observ Geoinf, 2008,10:476-485.
doi: 10.1016/j.jag.2007.11.002 |
| [32] |
Muhammad S, Zhan Y L, Niu Z, Wang L, Hao P Y. Analyzing the sensitivity of crops classification accuracy based on MODIS EVI time series and history ground reference data. Can J Remote Sens, 2015,41:536-546.
doi: 10.1080/07038992.2015.1112727 |
| [33] |
王利民, 杨玲波, 刘佳, 杨福刚, 姚保民. GF-1和MODIS影像冬小麦长势监测指标NDVI的对比. 作物学报, 2018,44:1043-1054.
doi: 10.3724/SP.J.1006.2018.01043 |
|
Wang L M, Yang L B, Liu J, Yang F G, Yao B M. Comparison of growth monitoring index NDVI between GF-1 and MODIS images in winter wheat. Acta Agron Sin, 2018,44:1043-1054 (in Chinese with English abstract).
doi: 10.3724/SP.J.1006.2018.01043 |
|
| [34] | 李震, 廖静娟. 合成孔径雷达地表参数反演模型与方法. 北京: 科学出版社, 2011. pp 262-304. |
| Li Z, Liao J J. Synthetic Aperture Radar Surface Parameters Inversion Model and Methods. Beijing: Science Press, 2011. pp 262-304(in Chinese). | |
| [35] |
黎夏, 叶嘉安, 王树功, 刘凯, 刘小平, 钱峻屏, 陈晓越, 何执兼, 覃朝锋. 红树林湿地植被生物量的雷达遥感估算. 遥感学报, 2006,10:387-396.
doi: 10.11834/jrs.20060359 |
|
Li X, Ye J A, Wang S G, Liu K, Liu X P, Qian J P, Chen X Y, He Z J, Qin C F. Estimating mangrove wetland biomass using radar remote. sensing. J Remote Sens, 2006,10:387-396 (in Chinese with English abstract).
doi: 10.11834/jrs.20060359 |
| [1] | 陈兵, 王克如, 李少昆, 肖春华, 苏毅, 唐强, 陈江鲁, 金秀良, 吕银亮, 刁万英, 王楷. 棉花黄萎病疑似病田的卫星遥感监测——以TM卫星影像为例[J]. 作物学报, 2012, 38(01): 129-139. |
|
||