欢迎访问作物学报,今天是
作物学报 ›› 2026, Vol. 52 ›› Issue (10): 3054-3068.doi: 10.3724/SP.J.1006.2026.61026
付元元1,2( ), 李帅锋1, 陈珂1, 夏天1, 冯海宽3, 束美艳1,2, 郭伟1,2, 乔红波1, 岳继博1,2,*()
Fu Yuan-Yuan1,2(), Li Shuai-Feng1, Chen Ke1, Xia Tian1, Feng Hai-Kuan3, Shu Mei-Yan1,2, Guo Wei1,2, Qiao Hong-Bo1, Yue Ji-Bo1,2,*()
摘要:
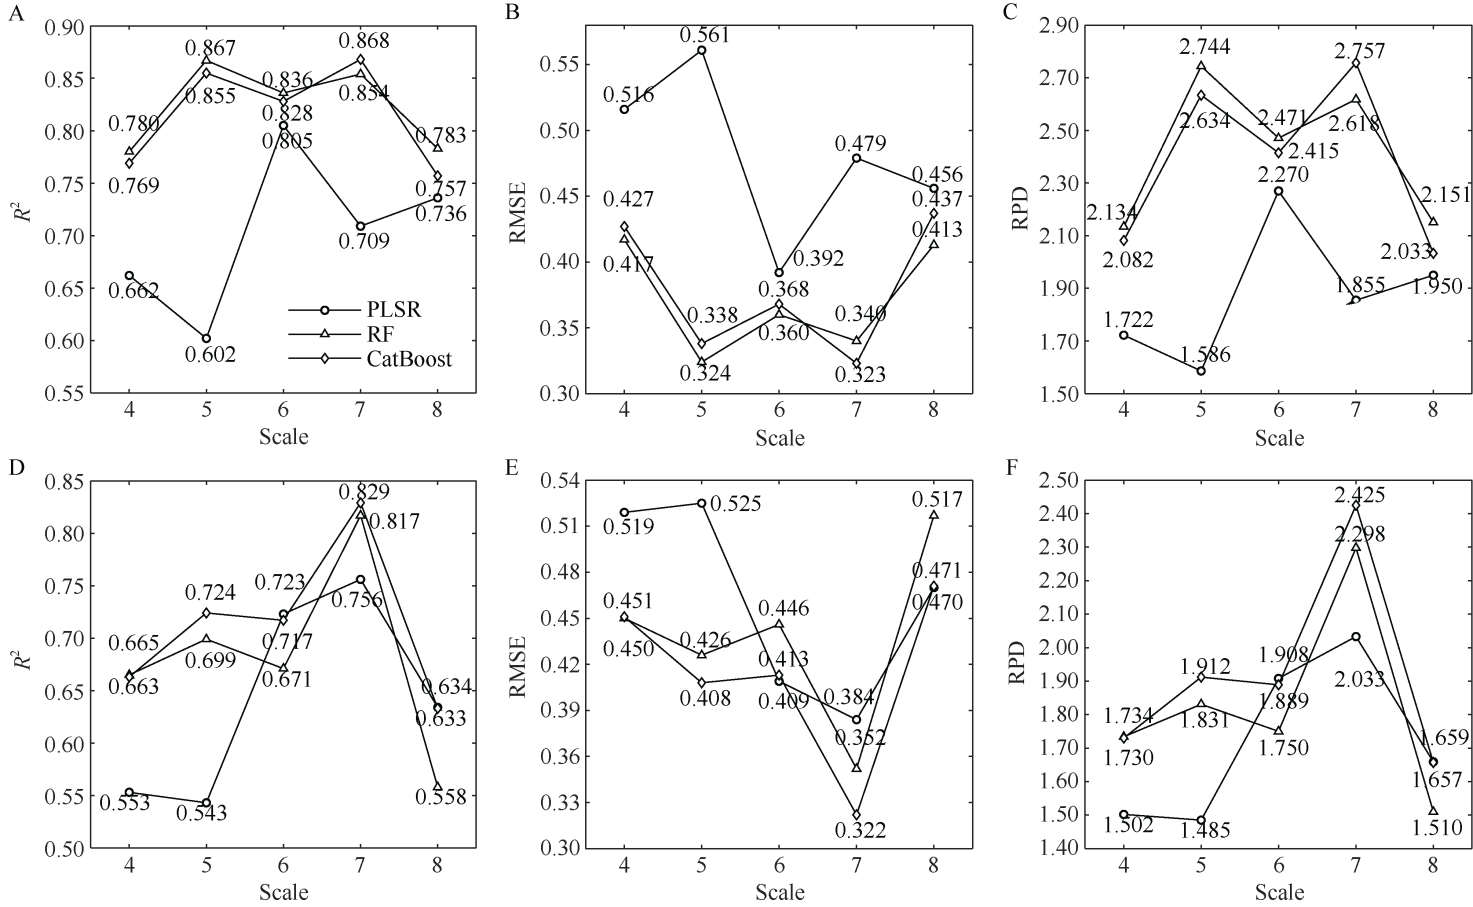
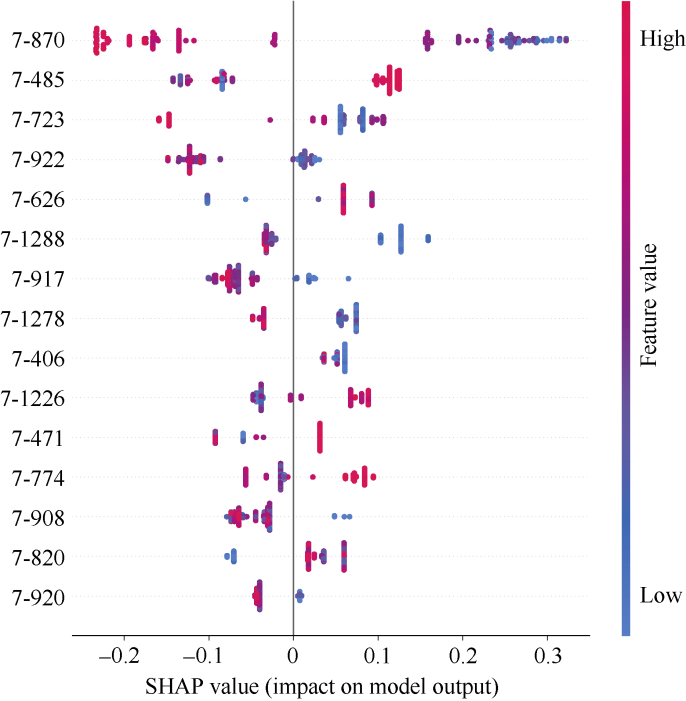
作物叶片氮浓度(LNC)的遥感诊断对指导作物精准施氮、提升氮素利用效率和增加产量具有重要意义。本研究针对传统连续投影算法(SPA)难以处理特征间非线性关系的问题, 提出了一种改进的连续投影算法, 即核化连续投影算法(KSPA)。本研究采用连续小波变换(CWT)对光谱进行多尺度分解, 结合KSPA提取与LNC相关的关键特征。同时, 以植被指数、SPA和偏最小二乘-变量投影重要性(PLS-VIP)作为对比方法, 分别构建偏最小二乘回归(PLSR)、随机森林(RF)和类别提升算法(CatBoost)模型估算冬小麦LNC, 并采用沙普利加性解释(SHAP)方法进行模型可解释性分析。结果表明, CWT中等分解尺度(第5至第7尺度)在估算冬小麦LNC中表现优异, KSPA筛选的特征能有效提升模型性能。CatBoost在CWT第7尺度上结合KSPA的表现最优(R2 = 0.829, RMSE = 0.322%, RPD = 2.425), 相较于PLS-VIP (RF模型: R2 = 0.729, RMSE = 0.405%)和SPA (CatBoost: R2 = 0.731, RMSE = 0.403%)的最优模型, R2分别提升了0.100和0.098, RMSE分别降低了0.083%和0.081%。跨年留一验证进一步证实了该方法的稳健性与泛化能力。改进后的算法能克服传统SPA特征筛选的线性局限性, 可为冬小麦氮营养精准监测提供参考。
| [1] |
Fu Y Y, Yang G J, Pu R L, et al. An overview of crop nitrogen status assessment using hyperspectral remote sensing: current status and perspectives. Eur J Agron, 2021, 124: 126241.
doi: 10.1016/j.eja.2021.126241 |
| [2] |
Zhao J, Li H, Liu J P, et al. Integration of spatial attention mechanism into 1D-CNN for prediction of wheat leaf nitrogen concentration from UAV-borne hyperspectral imagery. Comput Electron Agric, 2025, 239: 110906.
doi: 10.1016/j.compag.2025.110906 |
| [3] |
Fu Y Y, Yang G J, Li Z H, et al. Progress of hyperspectral data processing and modelling for cereal crop nitrogen monitoring. Comput Electron Agric, 2020, 172: 105321.
doi: 10.1016/j.compag.2020.105321 |
| [4] |
梁进宇, 尹嘉德, 王红丽, 等. 基于无人机高光谱和机器学习的旱地饲用玉米叶片氮含量估测. 作物学报, 2026, 52: 1788-1801.
doi: 10.3724/SP.J.1006.2026.53085 |
|
Liang J Y, Yin J D, Wang H L, et al. Estimation of leaf nitrogen content in dryland forage maize using UAV-based hyperspectral imaging and machine learning. Acta Agron Sin, 2026, 52: 1788-1801 (in Chinese with English abstract).
doi: 10.3724/SP.J.1006.2026.53085 |
|
| [5] | 李艳大, 曹中盛, 潘玉霞, 等. 基于便携式蜜柚光谱仪的金沙柚叶片氮含量监测模型研究. 果树学报, 2023, 40: 797-806. |
| Li Y D, Cao Z S, Pan Y X, et al. A model for monitoring leaf nitrogen content of Jinsha pomelo based on portable pomelo spectrometer. J Fruit Sci, 2023, 40: 797-806 (in Chinese with English abstract). | |
| [6] | 金庆宇, 孟庆伟, 闫东, 等. 光谱指数优化提高玉米叶片氮浓度估测精度. 玉米科学, 2025, 33(4): 65-74. |
| Jin Q Y, Meng Q W, Yan D, et al. Optimization of spectral indices for improved accuracy in estimating nitrogen concentration in maize leaves. J Maize Sci, 2025, 33(4): 65-74 (in Chinese with English abstract). | |
| [7] | 郭新惠, 乔星星, 赵钰, 等. 不同施氮水平下冬小麦叶片氮含量的高光谱遥感监测. 山西农业科学, 2025, 53(5): 92-100. |
| Guo X H, Qiao X X, Zhao Y, et al. Hyperspectral remote sensing monitoring of leaf nitrogen content in winter wheat under different nitrogen application levels. J Shanxi Agric Sci, 2025, 53(5): 92-100 (in Chinese with English abstract). | |
| [8] | 杨锡震, 陈俊英, 张秋雨, 等. 基于小波特征和冬小麦生理参数的土壤水分高光谱模型优化. 农业工程学报, 2023, 39(10): 66-75. |
| Yang X Z, Chen J Y, Zhang Q Y, et al. Optimization of the soil moisture model based on hyperspectral inversion by integrating wavelet features and growth parameters of winter wheat. Trans CSAE, 2023, 39(10): 66-75 (in Chinese with English abstract). | |
| [9] | 樊杰杰, 邱春霞, 樊意广, 等. 基于连续小波变换和机器学习的小麦产量预测. 光谱学与光谱分析, 2024, 44: 2890-2899. |
| Fan J J, Qiu C X, Fan Y G, et al. Wheat yield prediction based on continuous wavelet transform and machine learning. Spectrosc Spectr Anal, 2024, 44: 2890-2899 (in Chinese with English abstract). | |
| [10] |
Zhao X H, Zhang J C, Pu R L, et al. The continuous wavelet projections algorithm: a practical spectral-feature-mining approach for crop detection. Crop J, 2022, 10: 1264-1273.
doi: 10.1016/j.cj.2022.04.018 |
| [11] |
Chen X K, Li F L, Chang Q R. Combination of continuous wavelet transform and successive projection algorithm for the estimation of winter wheat plant nitrogen concentration. Remote Sens, 2023, 15: 997.
doi: 10.3390/rs15040997 |
| [12] |
Li L T, Geng S N, Lin D, et al. Accurate modeling of vertical leaf nitrogen distribution in summer maize using in situ leaf spectroscopy via CWT and PLS-based approaches. Eur J Agron, 2022, 140: 126607.
doi: 10.1016/j.eja.2022.126607 |
| [13] |
Wang Z L, Chen J X, Zhang J W, et al. Assessing canopy nitrogen and carbon content in maize by canopy spectral reflectance and uninformative variable elimination. Crop J, 2022, 10: 1224-1238.
doi: 10.1016/j.cj.2021.12.005 |
| [14] |
Wang J J, Bensmail H, Gao X. Feature selection and multi-kernel learning for sparse representation on a manifold. Neural Netw, 2014, 51: 9-16.
doi: 10.1016/j.neunet.2013.11.009 |
| [15] |
Yamada M, Jitkrittum W, Sigal L, et al. High-dimensional feature selection by feature-wise kernelized Lasso. Neural Comput, 2014, 26: 185-207.
doi: 10.1162/NECO_a_00537 pmid: 24102126 |
| [16] | Wang K Z, Xiao H T. Sparse kernel feature extraction via support vector learning. Pattern Recognit Lett, 2018, 101: 67-73. |
| [17] |
Tian Y C, Yao X, Yang J, et al. Assessing newly developed and published vegetation indices for estimating rice leaf nitrogen concentration with ground- and space-based hyperspectral reflectance. Field Crops Res, 2011, 120: 299-310.
doi: 10.1016/j.fcr.2010.11.002 |
| [18] |
He L, Song X, Feng W, et al. Improved remote sensing of leaf nitrogen concentration in winter wheat using multi-angular hyperspectral data. Remote Sens Environ, 2016, 174: 122-133.
doi: 10.1016/j.rse.2015.12.007 |
| [19] |
Li L, Liu S S, Wang S Q, et al. Assessing plant nitrogen concentration in winter oilseed rape using hyperspectral measurements. J Appl Remote Sens, 2016, 10: 036026.
doi: 10.1117/1.JRS.10.036026 |
| [20] |
Feng W, Yao X, Zhu Y, et al. Monitoring leaf nitrogen status with hyperspectral reflectance in wheat. Eur J Agron, 2008, 28: 394-404.
doi: 10.1016/j.eja.2007.11.005 |
| [21] |
Ranjan R, Chopra U K, Sahoo R N, et al. Assessment of plant nitrogen stress in wheat (Triticum aestivum L.) through hyperspectral indices. Int J Remote Sens, 2012, 33: 6342-6360.
doi: 10.1080/01431161.2012.687473 |
| [22] |
Zhou X F, Huang W J, Kong W P, et al. Remote estimation of canopy nitrogen content in winter wheat using airborne hyperspectral reflectance measurements. Adv Space Res, 2016, 58: 1627-1637.
doi: 10.1016/j.asr.2016.06.034 |
| [23] |
Feng W, Guo B B, Zhang H Y, et al. Remote estimation of above ground nitrogen uptake during vegetative growth in winter wheat using hyperspectral red-edge ratio data. Field Crops Res, 2015, 180: 197-206.
doi: 10.1016/j.fcr.2015.05.020 |
| [24] |
Yu K, Li F, Gnyp M L, et al. Remotely detecting canopy nitrogen concentration and uptake of paddy rice in the Northeast China Plain. ISPRS J Photogramm Remote Sens, 2013, 78: 102-115.
doi: 10.1016/j.isprsjprs.2013.01.008 |
| [25] |
Cheng X Z, Feng Y Y, Guo A T, et al. Detection of rubber tree powdery mildew from leaf level hyperspectral data using continuous wavelet transform and machine learning. Remote Sens, 2024, 16: 105.
doi: 10.3390/rs16010105 |
| [26] |
Li F L, Wang L, Liu J, et al. Evaluation of leaf N concentration in winter wheat based on discrete wavelet transform analysis. Remote Sens, 2019, 11: 1331.
doi: 10.3390/rs11111331 |
| [27] |
Breiman L. Random forests. Mach Learn, 2001, 45: 5-32.
doi: 10.1023/A:1010933404324 |
| [28] |
Hancock J T, Khoshgoftaar T M. CatBoost for big data: an interdisciplinary review. J Big Data, 2020, 7: 94.
doi: 10.1186/s40537-020-00369-8 pmid: 33169094 |
| [29] | 林娜, 全海琳, 李双桃, 等. 基于SHAP可解释特征优选的撂荒耕地遥感提取. 农业工程学报, 2025, 41(14): 291-302. |
| Lin N, Quan H L, Li S T, et al. Extracting abandoned farmland from remote sensing images using SHAP-interpretable feature optimization. Trans CSAE, 2025, 41(14): 291-302 (in Chinese with English abstract). | |
| [30] |
Chang C W, Laird D A. Near-infrared reflectance spectroscopic analysis of soil C and N. Soil Sci, 2002, 167: 110-116.
doi: 10.1097/00010694-200202000-00003 |
| [31] |
Liu N, Xing Z Z, Zhao R M, et al. Analysis of chlorophyll concentration in potato crop by coupling continuous wavelet transform and spectral variable optimization. Remote Sens, 2020, 12: 2826.
doi: 10.3390/rs12172826 |
| No related articles found! |
|
||