欢迎访问作物学报,今天是
作物学报 ›› 2024, Vol. 50 ›› Issue (1): 149-160.doi: 10.3724/SP.J.1006.2024.24265
邵扬1( ), 郭延平1, 周丙月2, 张峰3,4, 张兴民2, 王玉萍2,4,*()
SHAO Yang1(), GUO Yan-Ping1, ZHOU Bing-Yue2, ZHANG Feng3,4, ZHANG Xin-Ming2, WANG Yu-Ping2,4,*()
摘要:
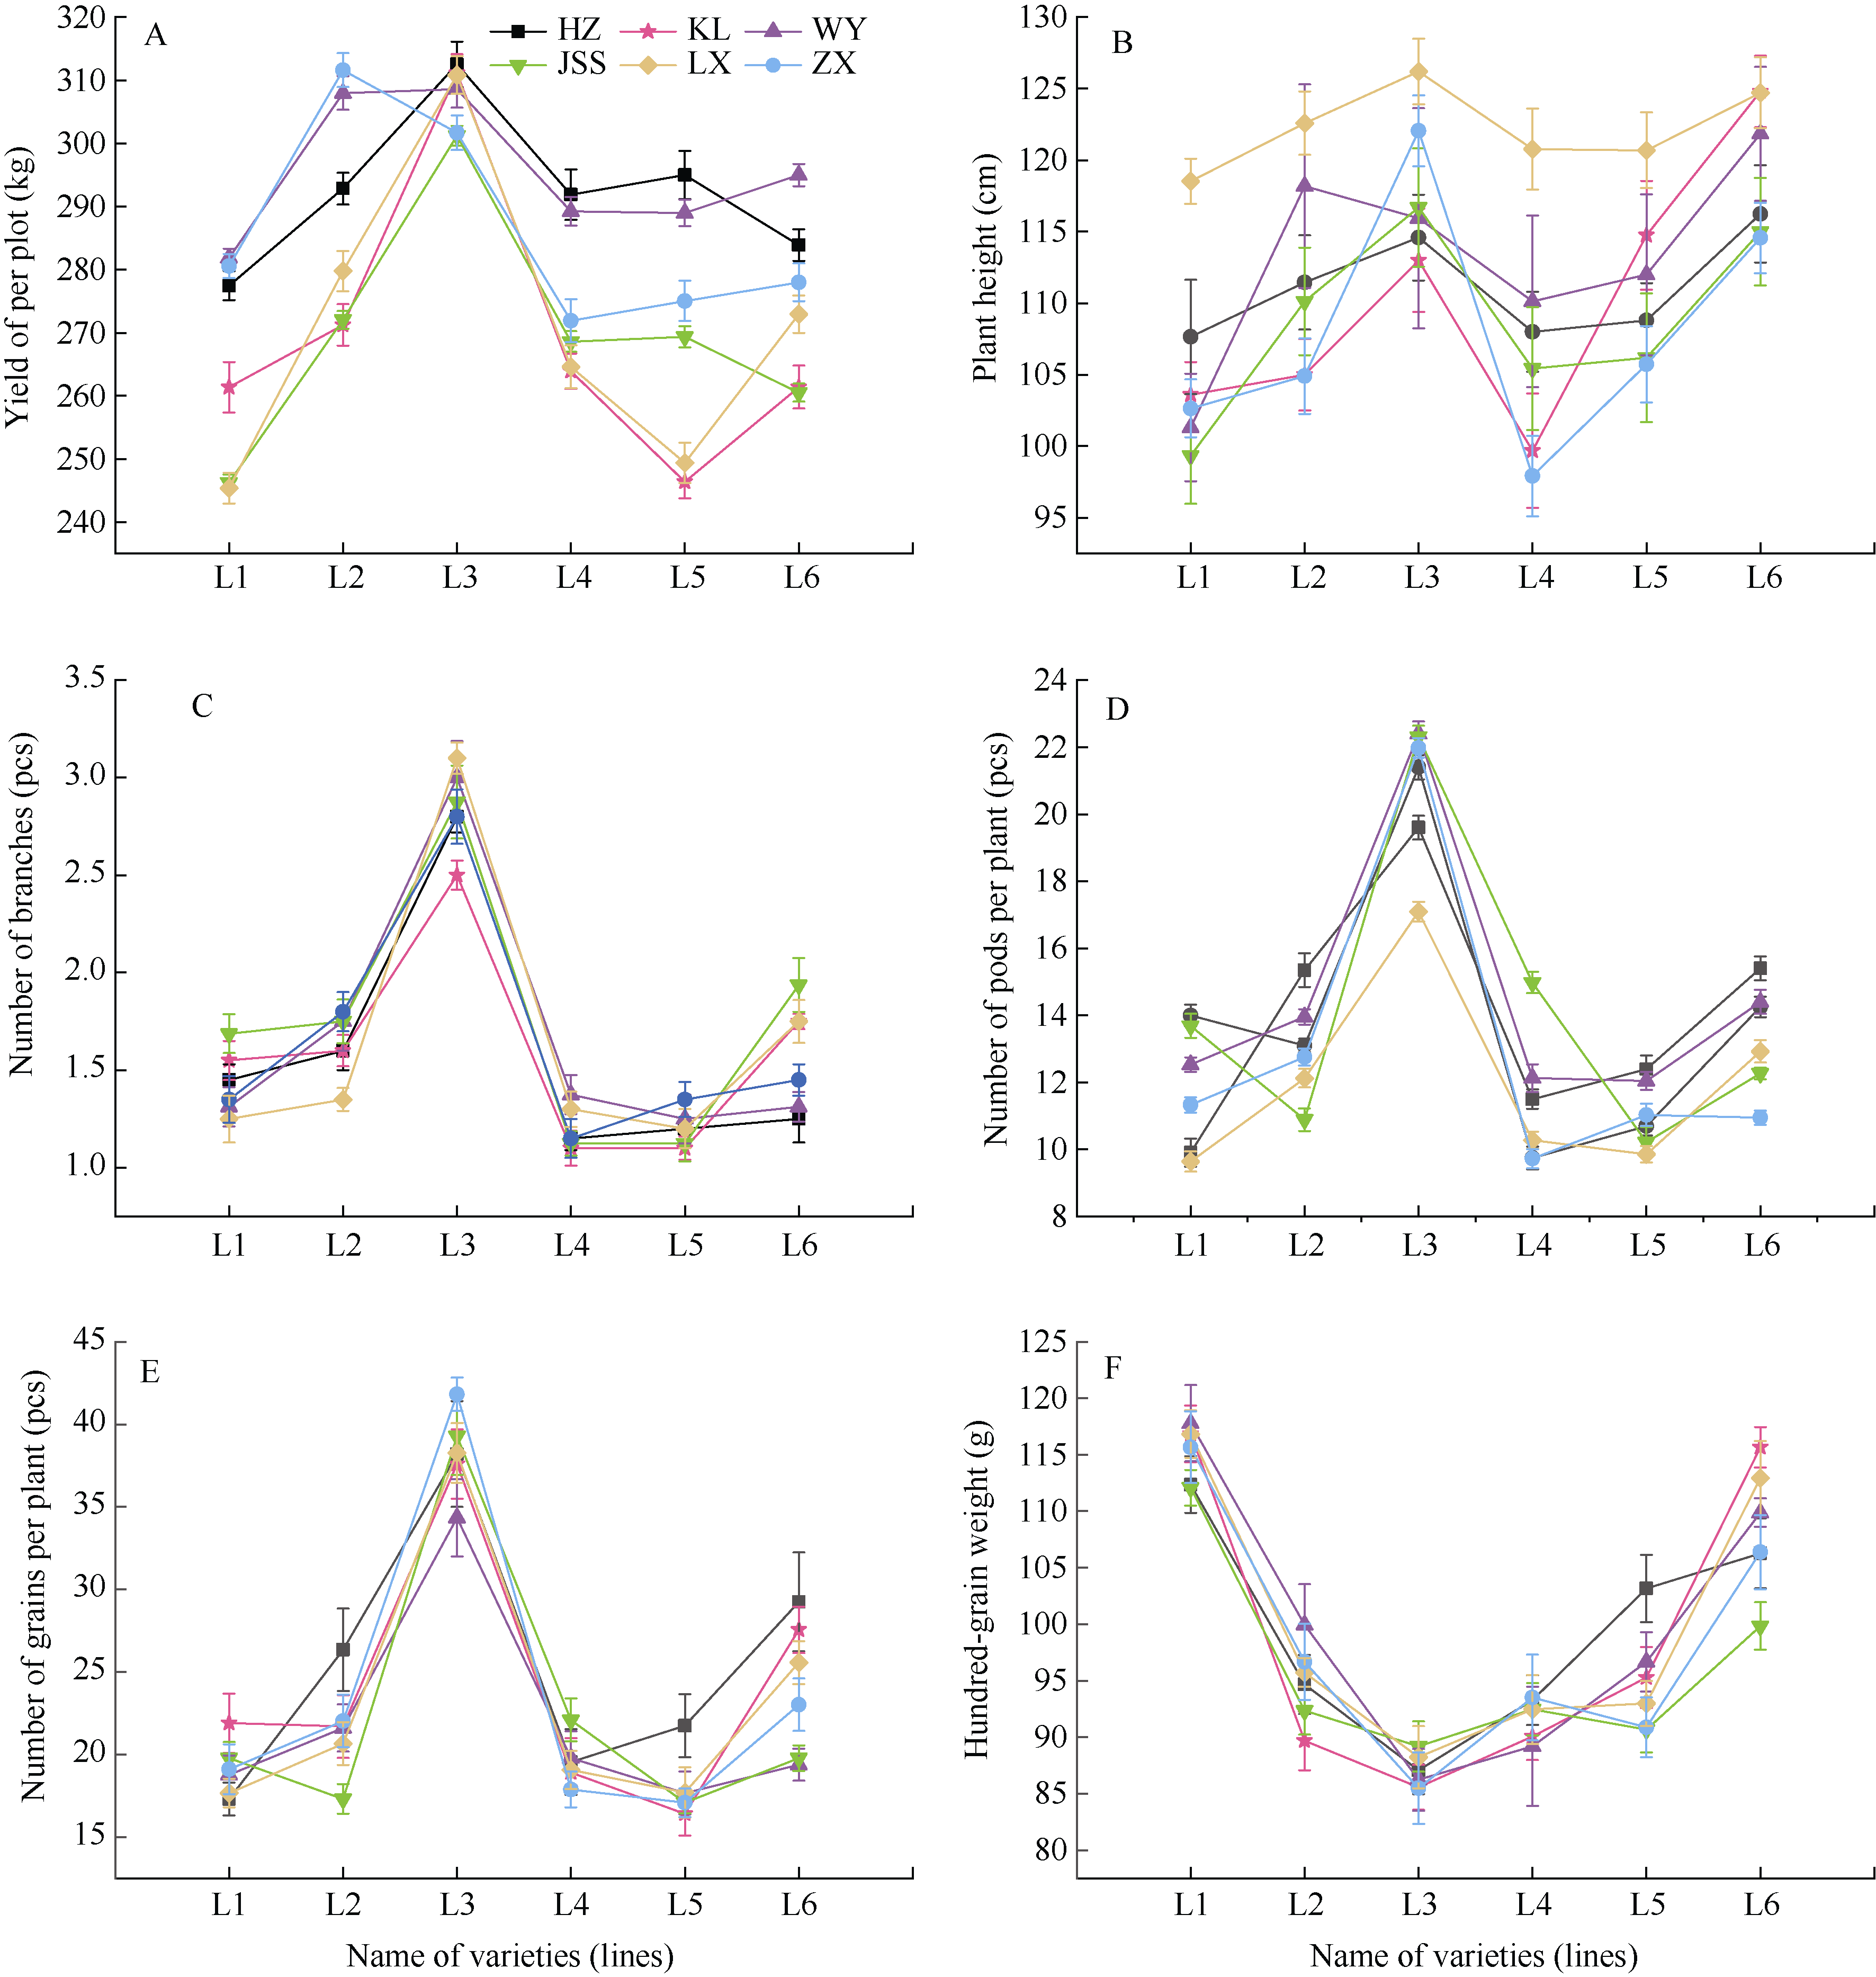
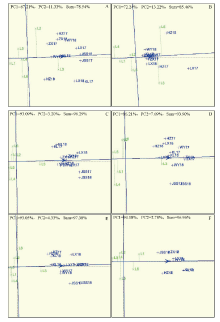
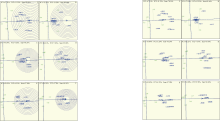
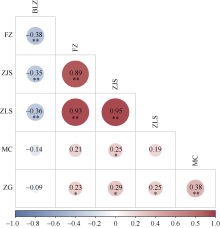
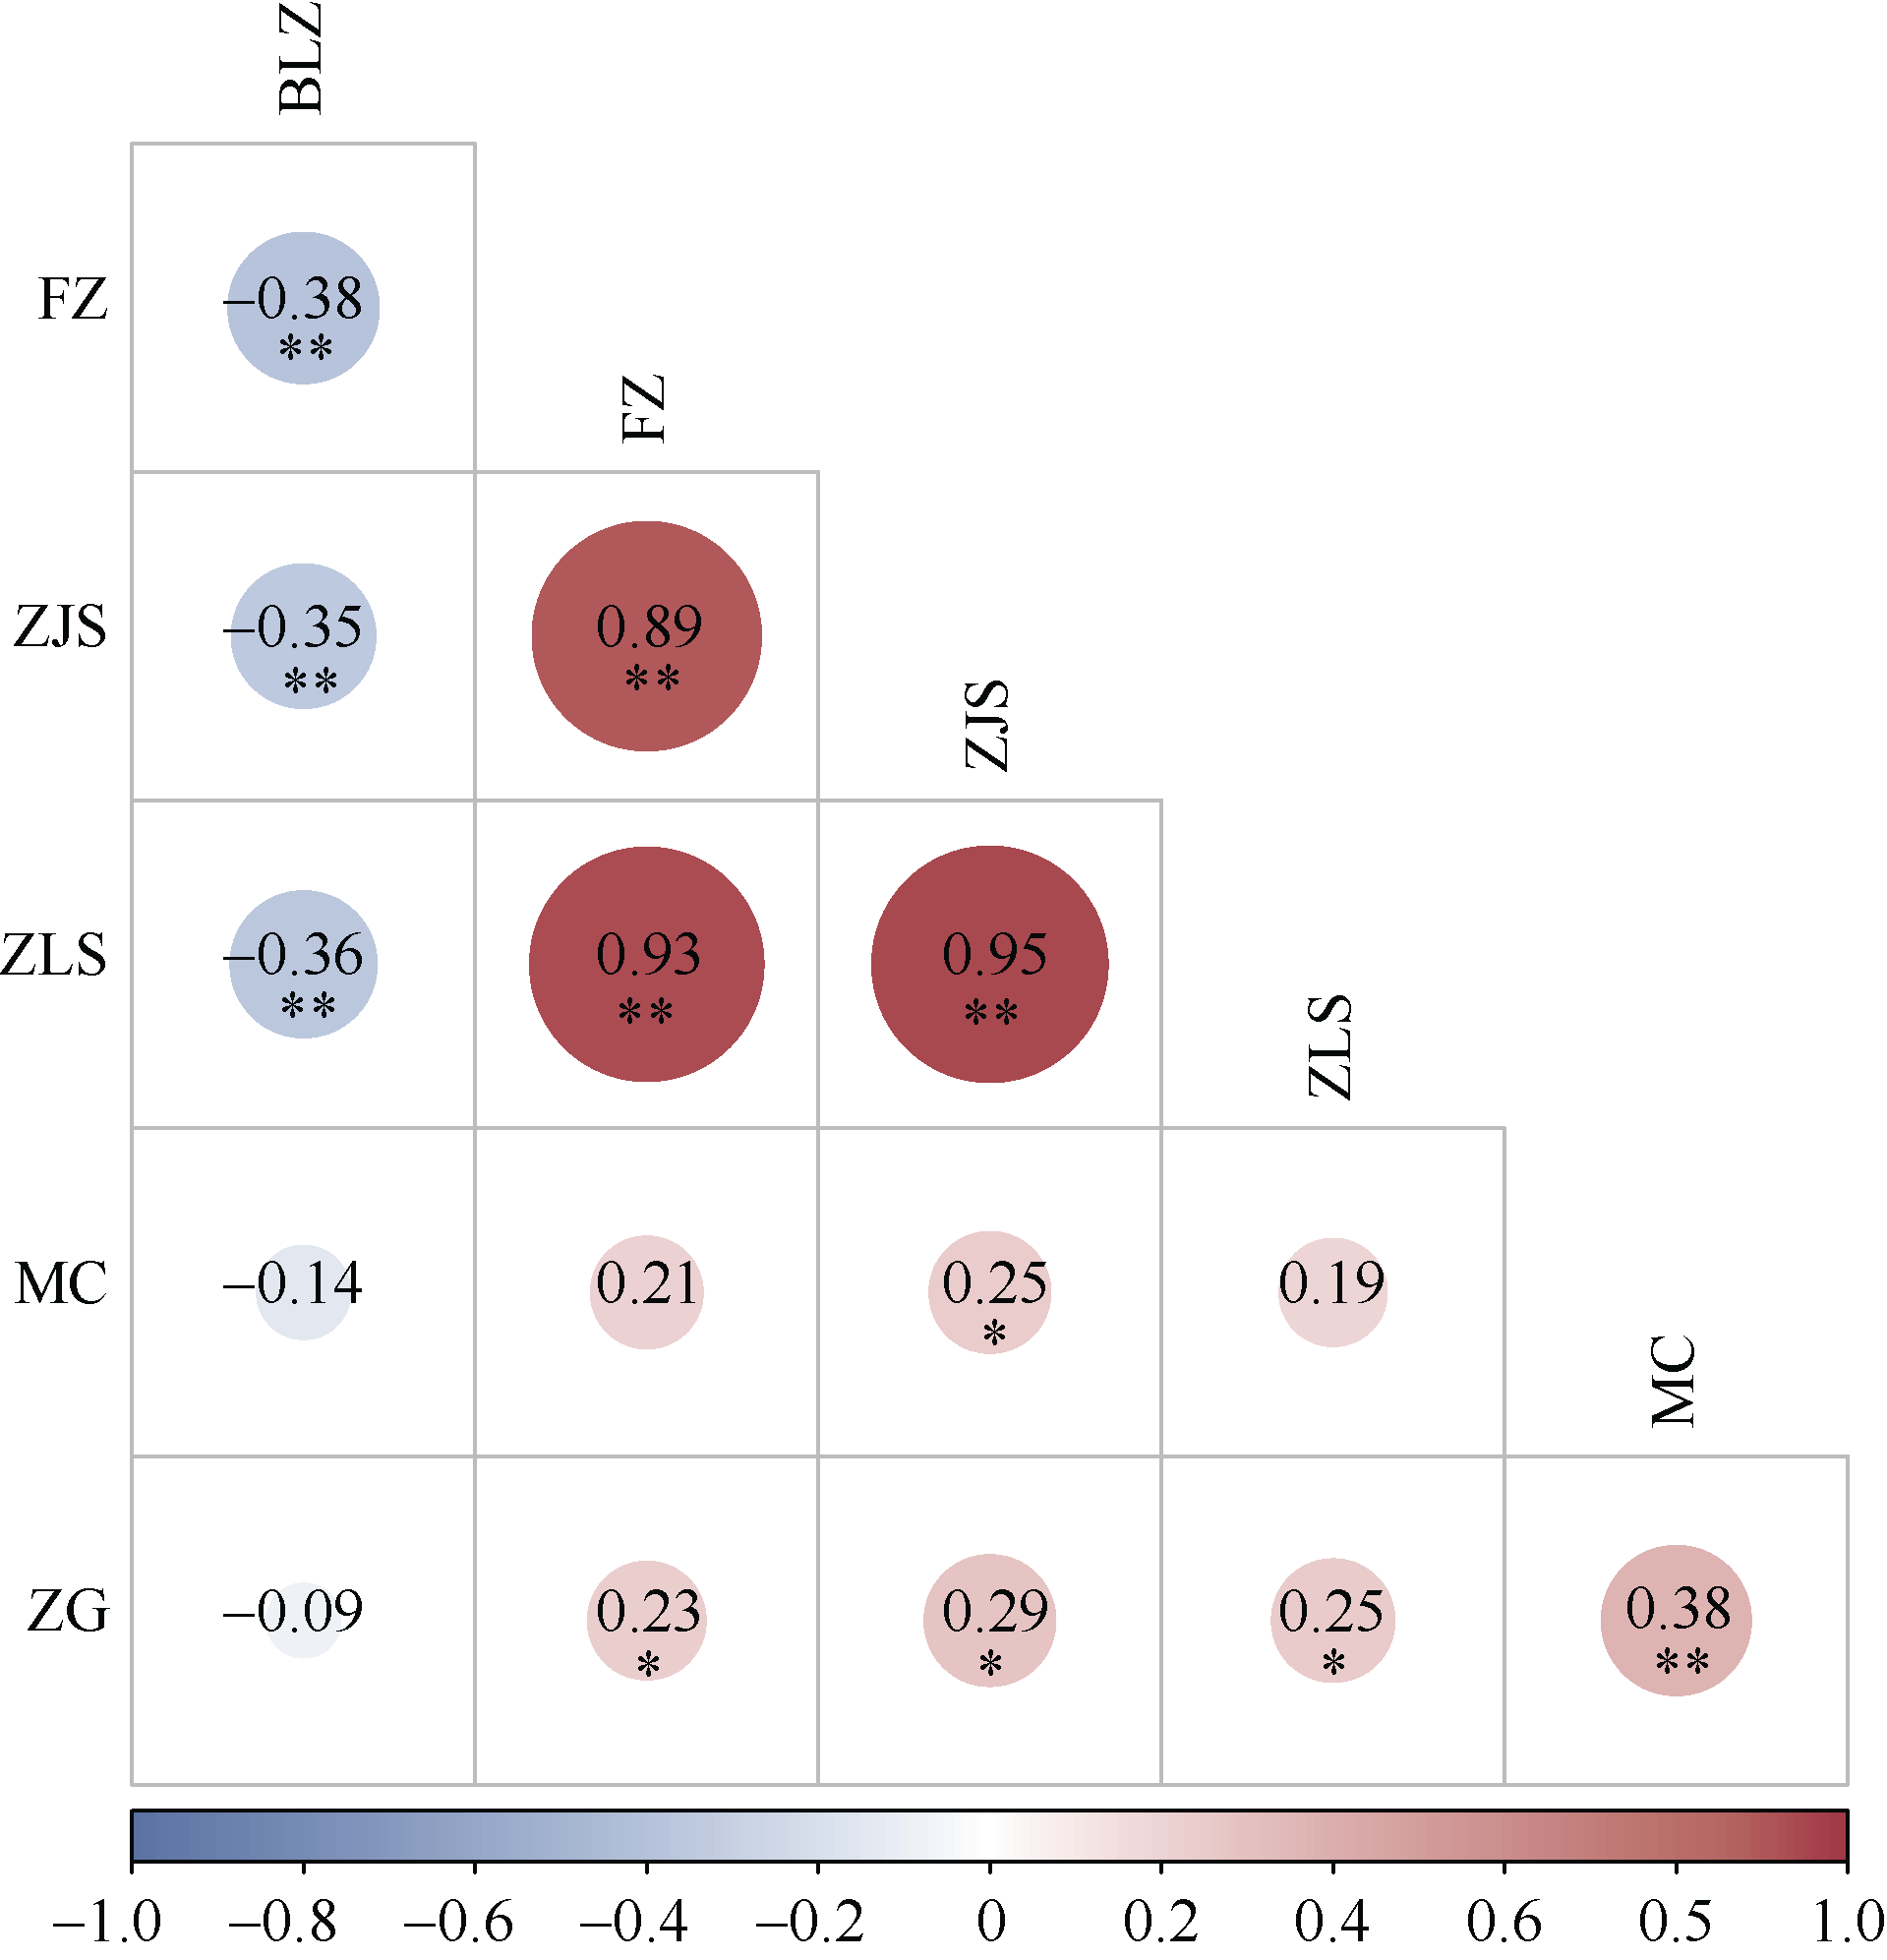
本研究通过综合评价蚕豆品系产量性状在不同试点的丰产性、适应性和稳定性, 筛选适应不同生态环境的产量性状稳定的优良品种(系)。同时评价各试点的区分力和代表性, 为试点选择提供依据。2017年和2018年在甘肃和政县、康乐县、积石山县、渭源县、临夏县和漳县6个试点分别种植5个蚕豆品系0215-1-4 (L1)、0208-3-1 (L2)、0208-3-2 (L3)、0323-2-1 (L4)、0161-1 (L5)与1个对照品种和政尕蚕豆(L6), 收获时记录株高、株粒数、小区产量、株荚数、分枝数、百粒重。采用联合方差和GGE (genotype + genotypes and environment interactions, GGE)双标图对产量性状进行基因型和基因型与环境互作分析。联合方差分析表明, 6个农艺性状的基因型除小区产量和株高基因型与环境互作效应无显著差异外, 其余性状的基因型与×环境互作效应均达到极显著水平(P<0.01); 除株高和株粒数基因型×年份互作效应达到极显著水平外(P<0.01), 其余农艺性状×年份互作效应无显著差异。相关性分析表明, 小区产量与株荚数和株粒数正相关, 与株荚数显著正相关(P<0.05), 与百粒重负相关。GGE分析结果表明, 品种(系)的适应性、丰产性和稳定性以及试点的区分力和代表性均具有较高的GGE变异值, 变幅在78.54%~97.38%之间。蚕豆品系L3在康乐县、积石山县、渭源县和临夏县试点的产量适应性均较高, 在和政县试点2018年产量适应性最高; 丰产性高的品种(系)依次为L3>L2>L6>L4, 稳定性最高的品种(系)依次为L4>L1>L5>L3。试点的区分力依次为康乐县2017年、积石山县2017年和2018年, 试点的代表性依次为渭源县2017年、康乐县2018年、积石山县2018年。高产且稳定的品系是L3和L4, 结合试点的区分力和代表性, 最理想的生态区试点是积石山县。本研究利用GGE双标图对甘肃蚕豆参试品种进行产量组分性状分析, 为蚕豆品种综合评价提供参考。
| [1] | 张红岩, 郭兴莲, 杨涛, 刘荣, 黄宇宁, 季一山, 王栋, 宗绪晓. 利用SSR标记分析蚕豆品种(品系)与优异种质的遗传多样性. 中国蔬菜, 2018, (2): 34-41. |
| Zhang H Y, Guo X L, Yang T, Liu R, Huang Y N, Ji Y S, Wang D, Zong X X. Genetic diversity of faba bean varities (lines) and elite collections by SSR markers. China Veget, 2018, (2): 34-41. (in Chinese with English abstract) | |
| [2] | 李萍, 张雁霞, 刘玉皎. PEG胁迫下西北不同蚕豆种子萌发期的抗寒性鉴定. 四川农业大学学报, 2015, 33: 251-257. |
| Li P, Zhang Y X, Liu Y J. Drought tolerance of different faba beans during the germination stage under PEG stress in the northwest China. J Sichuan Agric Univ, 2015, 33: 251-257. (in Chinese with English abstract) | |
| [3] |
Rakshit S, Ganapathy K N, Gomashe S S, Rathore A, Ghorade R B, Nagesh Kumar M V, Ganesmurthy K, Jain S K, Kamtar M Y, Sachan J S, Ambekar S S, Ranwa B R, Kanawade M, Balusamy D G, Kadam D, Sarkar A, Tonapi V A, Patil J V. GGE biplot analysis to evaluate genotype, environment, and their interactions in sorghum multi-location data. Euphytica, 2012, 185: 465-479.
doi: 10.1007/s10681-012-0648-6 |
| [4] |
Cooper M, DeLacy I H. Relationships among analytical methods used to study genotypic variation and genotype-by-environment interaction in plant breeding multi-environment experiments. Theor Appl Genet, 1994, 88: 561-572.
doi: 10.1007/BF01240919 pmid: 24186111 |
| [5] |
Crossa J, Cornelius P L, Sayre K, Iván Ortiz-Monasterio R J. A shifted multiplicative model fusion method for grouping environments without cultivar rank change. Crop Sci, 1995, 35: 54-62.
doi: 10.2135/cropsci1995.0011183X003500010010x |
| [6] |
叶夕苗, 程鑫, 安聪聪, 袁剑龙, 余斌, 文国宏, 李高峰, 程李香, 王玉萍, 张峰. 马铃薯产量组分的基因型与环境互作及稳定性. 作物学报, 2020, 46: 354-364.
doi: 10.3724/SP.J.1006.2020.94089 |
|
Ye X M, Cheng X, An C C, Yuan J L, Yu B, Wen G H, Li G F, Cheng L X, Wang Y P, Zhang F. Genotype × environment interaction and stability of yield components for potato lines. Acta Agron Sin, 2020, 46: 354-364. (in Chinese with English abstract)
doi: 10.3724/SP.J.1006.2020.94089 |
|
| [7] |
Aastveit A H, Martens H. ANOVA interactions interpreted by partial least squares regression. Biometrics, 1986, 42: 829-844.
doi: 10.2307/2530697 |
| [8] |
Finlay K W, Wilkinson G N. The analysis of adaptation in a plant-breeding programmer. Aust J Agric Res, 1963, 14: 742-754.
doi: 10.1071/AR9630742 |
| [9] |
Blouin D C, Webster E P, Bond J A. On the analysis of combined experiments. Weed Technol, 2015, 25: 165-169.
doi: 10.1614/WT-D-10-00047.1 |
| [10] |
Wang R, Hu D, Zheng H, Shu Y, Wei R. Genotype × environmental interaction by AMMI and GGE biplot analysis for the provenances of michelia chapensis in south China. J For Res, 2016, 27: 659-664.
doi: 10.1007/s11676-015-0181-2 |
| [11] |
Hugh G, Gauch J R. Statistical analysis of yield trials by AMMI and GGE. Crop Sci, 2006, 46: 1488-1500.
doi: 10.2135/cropsci2005.07-0193 |
| [12] | Yan W K, Kang M S, Ma B L, Woods S, Cornelius P L. GGE Biplot vs. AMMI analysis of genotype-by-environment data. Crop Sci, 2007, 47: 641-653. |
| [13] |
Nzuve F, Githiri S, Mulunya D M, Gethi J. Analysis of genotype × environment interaction for grain yield in maize hybrids. J Agric Sci, 2013, 5: 75-85.
doi: 10.1002/jsfa.v5:2 |
| [14] |
Bednarz C W, Bridges D C, Brown S M. Analysis of cotton yield stability across population densities. Agron J, 2000, 92: 128-135.
doi: 10.2134/agronj2000.921128x |
| [15] |
Yan W K, Rajcan I. Biplot analysis of test sites and trait relations of soybean in Ontario. Crop Sci, 2002, 42: 11-20.
pmid: 11756248 |
| [16] | 崔顺立, 何美敬, 侯名语, 杨鑫雷, 穆国俊, 刘立峰. 利用GGE双标图分析花生品质性状的基因型-环境互作. 中国油料作物学报, 2021, 43: 617-626. |
|
Cui S L, He J M, Hou M Y, Yang X L, Mu G J, Liu L F. Genotype × environment interactions for the quality traits of peanut varieties based on GGE biplot analysis. Chin J Oil Crop Sci, 2021, 43: 617-626. (in Chinese with English abstract)
doi: 10.19802/j.issn.1007-9084.2021039 |
|
| [17] |
Frankham R. Introduction to quantitative genetics (4th edn). Trends Genet, 1996, 12: 280-280.
doi: 10.1016/0168-9525(96)81458-2 |
| [18] |
Burgueño J, de los Campos G, Weigel K, Crossa J. Genomic prediction of breeding values when modeling genotype × environment interaction using pedigree and dense molecular markers. Crop Sci, 2012, 52: 707-719.
doi: 10.2135/cropsci2011.06.0299 |
| [19] |
Phuke R M, Anuradha K, Radhika K, Jabeen F, Anuradha G, Ramesh T, Hariprasanna K, Mehtre S P, Deshpande S P, Anil G, Das R R, Rathore A, Hash T, Reddy B V S, Kumar A A. Genetic variability, genotype × environment interaction, correlation, and GGE biplot analysis for grain iron and zinc concentration and other agronomic traits in RIL population of sorghum (Sorghum bicolor L. Moench). Front Plant Sci, 2017, 8: 712.
doi: 10.3389/fpls.2017.00712 |
| [20] |
Shahriari Z, Heidari B, Dadkhodaie A, Chen Z H. Dissection of genotype × environment interactions for mucilage and seed yield in planta go species: application of AMMI and GGE biplot analyses. PLoS One, 2018, 13: e0196095.
doi: 10.1371/journal.pone.0196095 |
| [21] | 陆宏园, 张林杰, 李梅, 胡伟民, 关亚静, 胡晋. 蚕豆栽培品种综合性状的比较与分析. 浙江农业科学, 2015, 56: 993-997. |
| Lu H Y, Zhang L J, Li M, Hu W M, Guan Y J, Hu J. Comparison and analysis of comprehensive characters of faba bean cultivars. Zhengjiang Agric Sci, 2015, 56: 993-997. (in Chinese with English abstract) | |
| [22] | 严威凯. 农作物品种试验数据管理与分析. 北京: 中国农业科学技术出版社, 2015. pp 28-137. |
| Yan W K. Crop Variety Test Data Management and Analysis. Beijing: China Agricultural Science and Technology Press, 2015. pp 28-137. (in Chinese) | |
| [23] |
严威凯. 双标图分析在农作物品种多点试验中的应用. 作物学报, 2010, 36: 1805-1819.
doi: 10.3724/SP.J.1006.2010.01805 |
| Yan W K. Application of biplot analysis in multi-point experiment of crop varieties. Acta Agron Sin, 2010, 36: 1805-1819. (in Chinese with English abstract) | |
| [24] |
Des Marais D L, Hernandez K M, Juenger T E. Genotype-by-environment interaction and plasticity: exploring genomic responses of plants to the abiotic environment. Annu Rev Ecol Evol Syst, 2013, 44: 5-29.
doi: 10.1146/ecolsys.2013.44.issue-1 |
| [25] | 李本贵, 阎俊, 何中虎, 李仲来. 用AMMI模型分析作物区域试验中的地点鉴别力. 作物学报, 2004, 30: 593-596. |
| Li B G, Yan J, He Z H, Li Z L. The AMMI model was used to analyze site discrimination in crop regional experiments. Acta Agron Sin, 2004, 30: 593-596 (in Chinese with English abstract). | |
| [26] | 李艳花, 陈红, 王萍, 杜成章, 张继君. 蚕豆高代材料单株产量与农艺性状的相关和通径分析. 江苏农业科学, 2018, 46(20): 79-81. |
| Li Y H, Chen H, Wang P, Du C Z, Zhang J J. Correlation and path analysis between yield per plant and agronomic traits of faba bean high-generation material. Jiangsu Agric Sci, 2018, 46(20): 79-81. (in Chinese with English abstract) |
| [1] | 魏正欣, 刘昌燕, 陈宏伟, 李莉, 孙龙清, 韩雪松, 焦春海, 沙爱华. 基于干旱胁迫转录组信息的蚕豆ASPAT基因家族分析[J]. 作物学报, 2023, 49(7): 1871-1881. |
| [2] | 刘玉玲, 张红岩, 滕长才, 周仙莉, 侯万伟. 蚕豆SSR标记遗传多样性及与淀粉含量的关联分析[J]. 作物学报, 2022, 48(11): 2786-2796. |
| [3] | 段灿星,董怀玉,李晓,李红,李春辉,孙素丽,朱振东,王晓鸣. 玉米种质资源大规模多年多点多病害的自然发病抗性鉴定[J]. 作物学报, 2020, 46(8): 1135-1145. |
| [4] | 叶夕苗,程鑫,安聪聪,袁剑龙,余斌,文国宏,李高峰,程李香,王玉萍,张峰. 马铃薯产量组分的基因型与环境互作及稳定性[J]. 作物学报, 2020, 46(3): 354-364. |
| [5] | 李萍,侯万伟,刘玉皎. 青海高原耐旱蚕豆品种青海13号响应干旱胁迫蛋白质组学分析[J]. 作物学报, 2019, 45(2): 267-275. |
| [6] | 罗俊,许莉萍,邱军,张华,袁照年,邓祖湖,陈如凯,阙友雄. 基于HA-GGE双标图的甘蔗试验环境评价及品种生态区划分[J]. 作物学报, 2015, 41(02): 214-227. |
| [7] | 许乃银,李健. 棉花区试中品种多性状选择的理想试验环境鉴别[J]. 作物学报, 2014, 40(11): 1936-1945. |
| [8] | 姜俊烨,杨涛,王芳,方俐,仲伟文,关建平,宗绪晓. 国内外蚕豆核心种质SSR遗传多样性对比及微核心种质构建[J]. 作物学报, 2014, 40(07): 1311-1319. |
| [9] | 许乃银,李健. 利用GGE双标图划分长江流域棉花纤维品质生态区[J]. 作物学报, 2014, 40(05): 891-898. |
| [10] | 罗俊,张华,邓祖湖,许莉萍,徐良年,袁照年,阙友雄. 应用GGE双标图分析甘蔗品种(系)的产量和品质性状[J]. 作物学报, 2013, 39(01): 142-152. |
| [11] | 许乃银,张国伟,李健,周治国. 基于HA-GGE双标图的长江流域棉花区域试验环境评价[J]. 作物学报, 2012, 38(12): 2229-2236. |
| [12] | 王海飞, 关建平, 马钰, 孙雪莲, 宗绪晓. 中国蚕豆种质资源ISSR标记遗传多样性分析[J]. 作物学报, 2011, 37(04): 595-602. |
| [13] | 赵世领,孙立荣,张换,马丽娅,陆宝石,郝福顺. 胞质碱化介导了外源一氧化氮诱导的蚕豆气孔关闭[J]. 作物学报, 2010, 36(3): 533-538. |
| [14] | 张志芬,付晓峰*,刘俊青,杨海顺. 用GGE双标图分析燕麦区域试验品系产量稳定性及试点代表性[J]. 作物学报, 2010, 36(08): 1377-1385. |
| [15] | 陈四龙,李玉荣,程增书,刘吉生. 用GGE双标图分析种植密度对高油花生生长和产量的影响[J]. 作物学报, 2009, 35(7): 1328-1335. |
|