欢迎访问作物学报,今天是

作物学报 ›› 2024, Vol. 50 ›› Issue (6): 1361-1372.doi: 10.3724/SP.J.1006.2024.33057

• 作物遗传育种·种质资源·分子遗传学 •    下一篇

二项分布双边收尾概率和假设检验统计量的几处修正

王建康*()   

  1. 中国农业科学院作物科学研究所 / 作物基因资源与育种国家重点实验室, 北京 100081
  • 收稿日期:2023-10-12 接受日期:2024-01-31 出版日期:2024-06-12 网络出版日期:2024-03-11
  • 通讯作者: * 王建康, E-mail: wangjiankang@caas.cn
  • 基金资助:
    国家自然科学基金项目(31861143003);中国农业科学院创新工程项目

Corrections to the two-sided probability and hypothesis test statistics on binomial distributions

WANG Jian-Kang*()   

  1. State Key Laboratory of Crop Gene Resources and Breeding / Institute of Crop Sciences, Chinese Academy of Agricultural Sciences, Beijing 100081, China
  • Received:2023-10-12 Accepted:2024-01-31 Published:2024-06-12 Published online:2024-03-11
  • Contact: * E-mail: wangjiankang@caas.cn
  • Supported by:
    National Natural Science Foundation of China(31861143003);Innovation Project of CAAS

摘要:

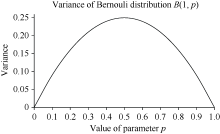
二项分布是广泛存在的一种离散型概率分布。服从二项分布B(n, p)的一个随机变量等于n个相互独立且服从贝努利分布B(1, p)的随机变量之和, 二项分布包含参数p的估计与检验等同于贝努利分布参数p的估计与检验。本文修正常见教科书中有关二项分布双边收尾概率计算和假设检验统计量构建中存在的3处问题。(1) 对二项分布B(n, p)的取值概率pk(k = 0, 1, ···, n)从小到大排序, 排序后的概率用p(k)表示, 观测值k的双边收尾精确概率等于$\sum\limits_{i=0}^{k}{{{p}_{(i)}}}$; (2) 二项分布B(n, p)参数p与给定值p0的差异显著性检验统计量被修正为$u=\frac{\hat{p}-{{p}_{0}}}{\sqrt{\frac{\hat{p}\hat{q}}{n}}}$, 该统计量在大样本条件下近似服从正态分布N(p–p0, 1); (3) 二项分布B(n1, p1)和 B(n2, p2)的参数p1和p2差异显著性检验统计量被修正为$u=\frac{{{{\hat{p}}}_{1}}-{{{\hat{p}}}_{2}}}{\sqrt{\frac{{{{\hat{p}}}_{1}}{{{\hat{q}}}_{1}}}{{{n}_{1}}}+\frac{{{{\hat{p}}}_{2}}{{{\hat{q}}}_{2}}}{{{n}_{2}}}}}$, 该统计量在大样本条件下近似服从正态分布N(p1–p2, 1)。修正后的双边收尾概率是精确值, 不会出现概率大于1的问题。修正后的2个检验统计量无论原假设是否成立, 其大样本近似正态分布的方差均为1, 有利于准确研究备择假设条件下检验统计量的功效。此外, 文中还介绍了小样本条件下二项分布参数的精确检验, 对比分析了准确检验与近似检验的异同; 讨论了修正统计量的理论基础, 给出了小概率和大样本的判定标准, 列出了贝努利分布参数检验与正态分布均值检验的异同。期望读者能够从中了解到假设检验与统计推断作为统计学核心研究内容的全貌。

关键词: 二项分布, 正态分布, 假设检验, 检验统计量, 修正, 检验功效

Abstract:

Binomial distributions widely exist in nature and human society, which is classified as discrete by probability theory. In theoretical studies in mathematical statistics, a random variable of binomial distribution B(n, p) is equivalent to the sum of a number of n independent and identical variables of Bernoulli distribution B(1, p). Estimation and testing on parameter p of binomial distribution B(n, p) is therefore equivalent to those of Bernoulli distribution B(1, p). Three corrections were made in this article, relevant to the calculation of two-tailed probability, and the construction of hypothesis test statistics. (1) Assume pk(k = 0, 1, ···, n) is the probability list of binomial distribution B(n, p), and the probability by ascending order is given by p(k). The two-tailed exact probability is equal to $\sum\limits_{i=0}^{k}{{{p}_{(i)}}}$, given the value of the observed k. (2) When testing the difference between parameter p of B(n, p) against a given value p0, the test statistic was corrected by $u=\frac{\hat{p}-{{p}_{0}}}{\sqrt{\frac{\hat{p}\hat{q}}{n}}}$, which asymptotically approaches to normal distribution N(pp0, 1) under the condition of large samples. (3) When testing the difference between two parameters of binomial distributions B(n1, p1) and B(n2, p2), the test statistic was corrected by $u=\frac{{{{\hat{p}}}_{1}}-{{{\hat{p}}}_{2}}}{\sqrt{\frac{{{{\hat{p}}}_{1}}{{{\hat{q}}}_{1}}}{{{n}_{1}}}+\frac{{{{\hat{p}}}_{2}}{{{\hat{q}}}_{2}}}{{{n}_{2}}}}}$, which asymptotically approaches to normal distribution N(p1p2, 1) under the condition of large samples. By the correction, the two-tailed probability has the exact value, and avoids the embarrassing situation of a probability exceeding one. Under either the null or alternative hypothesis conditions, the asymptotical normal distributions always have the variance at one, and therefore are more suitable to study the statistical power in testing the alternative hypothesis. Exact test on binomial distributions under the condition of small samples was also introduced, together with the comparison between exact and approximate tests. Probability theory underlying the corrections was provided. Comparison was made between the tests on parameter of Bernoulli distribution and mean of normal distribution. The general rule in determining the small probability and large sample was present as well. By doing so, the author wishes to provide the readers with a perspective picture on hypothesis testing and statistical inference, consisting of the core content of modern statistics.

Key words: binomial distribution, normal distribution, hypothesis test, testing statistic, correction, testing power

图1

贝努利分布方差随参数p的变化曲线"

表1

二项分布B (n=30, p=0.75)的取值概率, 以及双尾、左尾和右尾概率"

取值k
Value k
取值概率pk
Probability at value k, pk [Eq.(3)]
双尾概率PI
Two tails, PI [Eq.(7)]
左尾概率PII
Left tail, PII [Eq.(8)]
右尾概率PIII
Right tail, PIII [Eq.(9)]
双尾概率PI
Two tails, PI [Eq.(10)]
13 0.0002 0.0002 0.0002 0.9999 0.0004
14 0.0006 0.0010 0.0008 0.9998 0.0016
15 0.0019 0.0047 0.0027 0.9992 0.0055
16 0.0054 0.0101 0.0082 0.9973 0.0164
17 0.0134 0.0322 0.0216 0.9918 0.0432
18 0.0291 0.0881 0.0507 0.9784 0.1013
19 0.0551 0.1432 0.1057 0.9493 0.2115
20 0.0909 0.2945 0.1966 0.8943 0.3932
21 0.1298 0.5290 0.3264 0.8034 0.6528
22 0.1593 0.8338 0.4857 0.6736 0.9714
23 0.1662 1.0000 0.6519 0.5143 1.0286
24 0.1455 0.6745 0.7974 0.3481 0.6961
25 0.1047 0.3992 0.9021 0.2026 0.4052
26 0.0604 0.2036 0.9626 0.0979 0.1957
27 0.0269 0.0590 0.9894 0.0374 0.0749
28 0.0086 0.0188 0.9980 0.0106 0.0212
29 0.0018 0.0028 0.9998 0.0020 0.0039
30 0.0002 0.0004 1.0000 0.0002 0.0004

表2

统计推断中两类错误的划分"

推断结果
Inference
假设的真伪 True or false of hypotheses
H0为真 H0 is true HA为真 HA is true
拒绝原假设H0
Reject H0
犯第一类错误(或假阳性)
Type I error (or false positive)
正确推断(或真阳性)
Correct
接受原假设H0
Accept H0
正确推断(或真阴性)
Correct
犯第二类错误(或假阴性)
Type II error (or false negative)

表3

假设检验的两种推断方法"

推断方法
Inference method
推断结果Inference results
拒绝原假设H0 Reject H0 接受原假设H0 Accept H0
样本落在拒绝域还是接受域
By rejection and acceptance regions
样本落在拒绝域内
Located in the rejection region
样本落在接受域内
Located in the acceptance region
样本显著性P值是否超过水平α
By significance probability
Pα P > α

表4

二项分布B(n, p)参数p精确检验和大样本近似检验的对比"

假设检验问题
Hypothesis testing
检验问题I
Test I [Eq.(16)]
检验问题II
Test II [Eq.(17)]
检验问题III
Test III [Eq.(18)]
原假设参数取值范围
Region of p under H0
{p0} [p0, 1] [0, p0]
备择假设参数取值范围
Region of p under HA
[0, p0)∪(p0, 1] [0, p0) (p0, 1]
小样本精确检验 Exact test of small samples
检验统计量及其精确分布
Test statistic and its distribution
k~B(n, p) Same as I Same as I
拒绝域
Rejection region
[k1, k2], k1< k2, and meet PI(k1) ≤ α, and PI(k2) ≤ α [0, k1], k1 meets PII(k1) ≤ α, and PII(k1-1) > α, [k2, n], k2 meets PIII(k2) ≤ α, and PIII(k2+1) > α
显著概率P
Significance probability P-value
PII(k1)+ PIII(k2) PII(k1) PIII(k2)
大样本近似检验 Approximate test of large samples
检验统计量及其近似分布
Test statistic and its approximate distribution
$u=\frac{\hat{p}-{{p}_{0}}}{\sqrt{\frac{\hat{p}\hat{q}}{n}}}\to N\left( 0,1 \right)$ Same as I Same as I
拒绝域
Rejection region
$\left( -\infty,{{u}_{\alpha /2}}\left] \cup \right[{{u}_{1-\alpha /2}},\infty \right)$ $\left( -\infty,{{u}_{\alpha }} \right]$ $\left[ {{u}_{1-\alpha }},\infty \right)$
显著概率P
Significance probability P-value
$\text{ }\!\!\Phi\!\!\text{ }\left( -\left| u \right| \right)+1-\text{ }\!\!\Phi\!\!\text{ }\left( \left| u \right| \right)=2\text{ }\!\!\Phi\!\!\text{ }\left( -\left| u \right| \right)$ $\text{ }\!\!\Phi\!\!\text{ }\left( u \right)$ $1-\text{ }\!\!\Phi\!\!\text{ }\left( u \right)$

表5

二项分布B(200, p)参数p与给定值p0差异显著性检验的功效"

原假设参数p0
Value of p0
备择假设参数p
Value of p
方差比值
Ratio of
variances
α=0.1 α=0.05 α=0.01
修正前
Eq.(20)
修正后
Eq.(21)
修正前
Eq.(20)
修正后
Eq.(21)
修正前
Eq.(20)
修正后
Eq.(21)
0.2 0.1 0.750 0.992 0.999 0.967 0.989 0.895 0.952
0.2 1.000 0.087 0.089 0.037 0.054 0.009 0.013
0.3 1.146 0.959 0.933 0.908 0.884 0.803 0.706
0.5 0.4 0.980 0.897 0.897 0.840 0.840 0.599 0.646
0.5 1.000 0.090 0.090 0.057 0.057 0.009 0.012
0.6 0.980 0.884 0.884 0.818 0.818 0.579 0.651
0.8 0.7 1.146 0.947 0.930 0.904 0.878 0.808 0.711
0.8 1.000 0.093 0.092 0.039 0.063 0.006 0.009
0.9 0.750 0.998 0.999 0.971 0.995 0.908 0.957

表6

二项分布B(200, p1)参数p1与二项分布B(100, p2)参数p2差异显著性的检验功效"

参数p1
Value of p1
参数p2
Value of p2
方差比值
Ratio of
variances
α=0.1 α=0.05 α=0.01
修正前
Eq.(28)
修正后
Eq.(29)
修正前
Eq.(28)
修正后
Eq.(29)
修正前
Eq.(28)
修正后
Eq.(29)
0.2 0.1 0.903 0.748 0.777 0.629 0.697 0.349 0.485
0.2 1.000 0.086 0.097 0.047 0.049 0.006 0.007
0.3 1.040 0.610 0.589 0.497 0.454 0.251 0.204
0.5 0.4 0.989 0.488 0.509 0.378 0.382 0.167 0.187
0.5 1.000 0.110 0.115 0.065 0.068 0.014 0.015
0.6 0.989 0.491 0.511 0.357 0.369 0.156 0.179
0.8 0.7 1.040 0.591 0.573 0.463 0.434 0.249 0.208
0.8 1.000 0.092 0.097 0.042 0.047 0.009 0.008
0.9 0.903 0.724 0.778 0.607 0.667 0.348 0.474

表7

二项分布B(n, p)取值概率与其近似正态分布N(np, npq)概率密度的最大绝对值差异"

样本量n
Sample size n
二项分布B(n, p)的参数p
Parameter p of binomial distribution B(n, p)
0.02 0.05 0.1 0.2 0.3 0.4 0.5
50 0.1222 0.0413 0.0180 0.0070 0.0036 0.0016 0.0006
100 0.0499 0.0194 0.0083 0.0036 0.0018 0.0008 0.0002
200 0.0248 0.0090 0.0042 0.0017 0.0009 0.0004 0.0001
500 0.0094 0.0036 0.0017 0.0007 0.0004 <0.0001 <0.0001
Between t(30) and N(0, 1) 0.0045

表8

正态分布N(μ, σ2)与贝努利分布B(1, p)的样本统计量及其抽样分布的对比"

总体参数或样本统计量
Parameter or sample statistic
正态分布N(μ, σ2)
Normal distribution N(μ, σ2)
贝努利分布B(1, p)
Bernoulli distribution B(1, p)
总体均值
Mean of distribution
μ p
总体方差
Variance of distribution
σ2 p(1-p)
分布的可加性
Additivity of distribution
$X\tilde{\ }N\left( {{\mu }_{1}},\sigma _{1}^{2} \right)$and $Y\tilde{\ }N\left( {{\mu }_{2}},\sigma _{2}^{2} \right)$are independent, then $X+Y\tilde{\ }N\left( {{\mu }_{1}}+{{\mu }_{2}},\sigma _{1}^{2}+\sigma _{2}^{2} \right)$ $X\tilde{\ }B\left( {{n}_{1}},p \right)$and $Y\tilde{\ }B\left( {{n}_{2}},p \right)$are independent, then $X+Y\tilde{\ }B\left( {{n}_{1}}+{{n}_{2}},p \right)$
样本之和
Sample sum
${{X}_{1}}+{{X}_{2}}+\ldots +{{X}_{n}}$ Same as normal distribution
样本之和的分布
Distribution of sample sum
$N\left( n\mu,n{{\sigma }^{2}} \right)$ $B\left( n,p \right)$
样本均值
Sample mean
$\bar{X}=\frac{1}{n}\left( {{X}_{1}}+{{X}_{2}}+\ldots +{{X}_{n}} \right)$ Same as normal distribution
样本均值的分布
Distribution of sample mean
$\bar{X}\tilde{\ }N\left( \mu,\frac{1}{n}{{\sigma }^{2}} \right)$$\frac{\bar{X}-\mu }{\sqrt{\frac{{{\sigma }^{2}}}{n}}}\tilde{\ }N\left( 0,1 \right)$ $\frac{\bar{X}-p}{\sqrt{\frac{pq}{n}}}\to N\left( 0,1 \right)$ (approximate)
样本方差
Sample variance
${{s}^{2}}=\frac{1}{n-1}\left[ \left( X_{1}^{2}+X_{2}^{2}+\ldots +X_{n}^{2} \right)-n{{{\bar{X}}}^{2}} \right]$ Same as normal distribution
样本方差的分布
Distribution of sample variance
$\frac{\left( n-1 \right){{s}^{2}}}{{{\sigma }^{2}}}\tilde{\ }{{\chi }^{2}}\left( n-1 \right)$ See references [2] and [15]
[1] DeGroot M H, Schervish M J. Probability and Statistics (4th edn). Pearson Education Asia Ltd. and China Machine Press, 2012.
[2] 茆诗松, 程依明, 濮晓龙. 概率论与数理统计教程(第2版). 北京: 高等教育出版社, 2011.
Mao S S, Cheng Y M, Pu X L. Course on Probability Theory and Mathematical Statistics, 2nd edn. Beijing: Higher Education Press, 2011. (in Chinese)
[3] 刘来福, 程书肖. 生物统计. 北京: 北京师范大学出版社, 1988.
Liu L F, Cheng S X. Biometrics. Beijing: Beijing Normal University Press, 1988. (in Chinese)
[4] 李仲来, 刘来福, 程书肖. 生物统计(第2版), 北京师范大学出版社, 2007.
Li Z L, Liu L F, Cheng S X. Biometrics, 2nd edn. Beijing: Beijing Normal University Press, 2007. (in Chinese)
[5] 南京农业大学. 田间试验和统计方法(第2版). 北京: 农业出版社, 1991.
Nanjing Agricultural University. Field Experiments and Statistical Methods, 2nd edn. Beijing: Agriculture Press, 1991. (in Chinese)
[6] 盖钧镒, 管荣展. 试验统计方法(第5版). 北京: 中国农业出版社, 2020.
Gai J Y, Guan R Z. Experimental and Statistical Methods, 5th edn. Beijing: China Agriculture Press, 2020. (in Chinese)
[7] 明道绪. 田间试验与统计分析(第3版). 北京: 科学出版社, 2013.
Ming D X. Field Experiments and Statistical Analysis, 3rd edn. Beijing: Science Press, 2013. (in Chinese)
[8] 刘永建, 明道绪. 田间试验与统计分析(第4版). 北京: 科学出版社, 2020.
Liu Y J, Ming D X. Field Experiments and Statistical Analysis, 4th edn. Beijing: Science Press, 2020. (in Chinese)
[9] Hogg R V, McKean J W, Craig A T. Introduction to Mathematical Statistics (7th edn). Pearson Education Asia Ltd. and China Machine Press, 2012.
[10] 茆诗松, 程依明, 濮晓龙. 概率论与数理统计教程习题与答案. 高等教育出版社, 2005.
Mao S S, Cheng Y M, Pu X L. Exercises and Answerers to the Course on Probability Theory and Mathematical Statistics. Beijing: Higher Education Press, 2005. (in Chinese)
[11] Fisher R A. Statistical Methods, Experimental Design, and Scientific Inference. Oxford Science Publications, Reprinted, 2003
[12] Weir B S. Genetic Data Analysis II. Sinauer Associates, Inc., Sunderland, Massachusetts, 1996
[13] 王建康. 数量遗传学. 北京: 科学出版社, 2017.
Wang J K. Quantitative Genetics. Beijing: Science Press, 2007. (in Chinese)
[14] 《数学手册》编写组. 数学手册. 北京: 高等教育出版社, 1979.
Writing Group of the Mathematics Manual. Mathematics Manual. Beijing: Higher Education Press, 1979. (in Chinese)
[15] 茆诗松, 王静龙, 濮晓龙. 高等数理统计(第2版). 北京: 高等教育出版社, 2006.
Mao S S, Wang J L, Pu X L. Advanced Mathematical Statistics, 2nd edn. Beijing: Higher Education Press, 2006. (in Chinese)
No related articles found!
Viewed
Full text


Abstract

Cited

  Shared   
  Discussed   
[1] 李绍清, 李阳生, 吴福顺, 廖江林, 李达模. 水稻孕穗期在淹涝胁迫下施肥的优化选择及其作用机理[J]. 作物学报, 2002, 28(01): 115 -120 .
[2] 王兰珍;米国华;陈范骏;张福锁. 不同产量结构小麦品种对缺磷反应的分析[J]. 作物学报, 2003, 29(06): 867 -870 .
[3] 杨建昌;张亚洁;张建华;王志琴;朱庆森. 水分胁迫下水稻剑叶中多胺含量的变化及其与抗旱性的关系[J]. 作物学报, 2004, 30(11): 1069 -1075 .
[4] 袁美;杨光圣;傅廷栋;严红艳. 甘蓝型油菜生态型细胞质雄性不育两用系的研究Ⅲ. 8-8112AB的温度敏感性及其遗传[J]. 作物学报, 2003, 29(03): 330 -335 .
[5] 王永胜;王景;段静雅;王金发;刘良式. 水稻极度分蘖突变体的分离和遗传学初步研究[J]. 作物学报, 2002, 28(02): 235 -239 .
[6] 王丽燕;赵可夫. 玉米幼苗对盐胁迫的生理响应[J]. 作物学报, 2005, 31(02): 264 -268 .
[7] 田孟良;黄玉碧;谭功燮;刘永建;荣廷昭. 西南糯玉米地方品种waxy基因序列多态性分析[J]. 作物学报, 2008, 34(05): 729 -736 .
[8] 胡希远;李建平;宋喜芳. 空间统计分析在作物育种品系选择中的效果[J]. 作物学报, 2008, 34(03): 412 -417 .
[9] 王艳;邱立明;谢文娟;黄薇;叶锋;张富春;马纪. 昆虫抗冻蛋白基因转化烟草的抗寒性[J]. 作物学报, 2008, 34(03): 397 -402 .
[10] 郑希;吴建国;楼向阳;徐海明;石春海. 不同环境条件下稻米组氨酸和精氨酸的胚乳和母体植株QTL分析[J]. 作物学报, 2008, 34(03): 369 -375 .