欢迎访问作物学报,今天是
作物学报 ›› 2022, Vol. 48 ›› Issue (5): 1248-1261.doi: 10.3724/SP.J.1006.2022.02065
王泽1( ), 周钦阳1(), 刘聪1, 穆悦1, 郭威2, 丁艳锋1,*(), 二宫正士1,2,*()
WANG Ze1(), ZHOU Qin-Yang1(), LIU Cong1, MU Yue1, GUO Wei2, DING Yan-Feng1,*(), NINOMIYA Seishi1,2,*()
摘要:
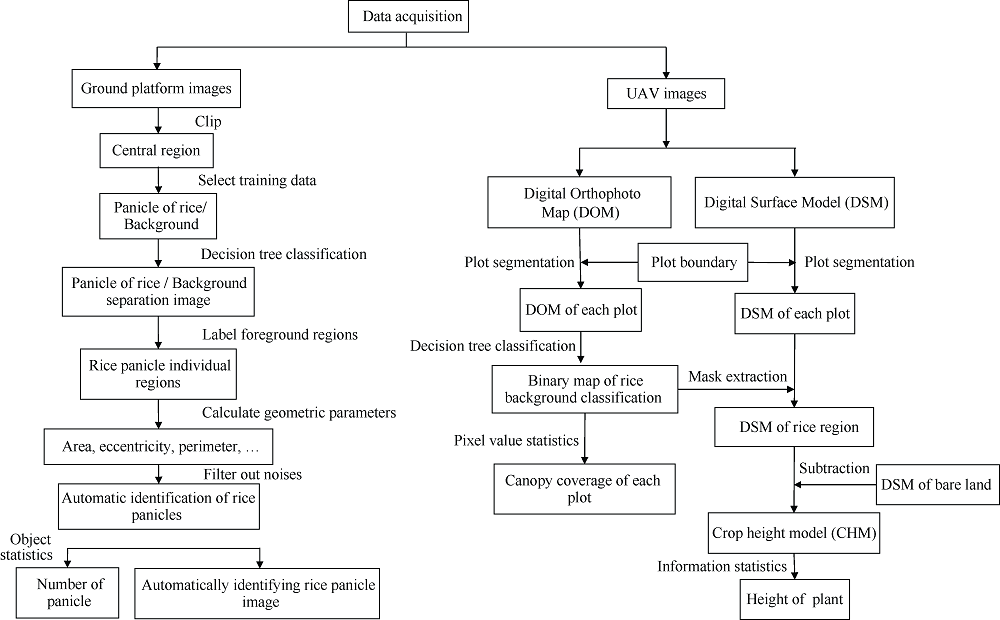
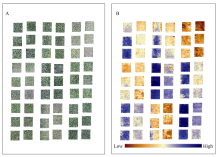
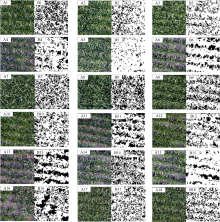
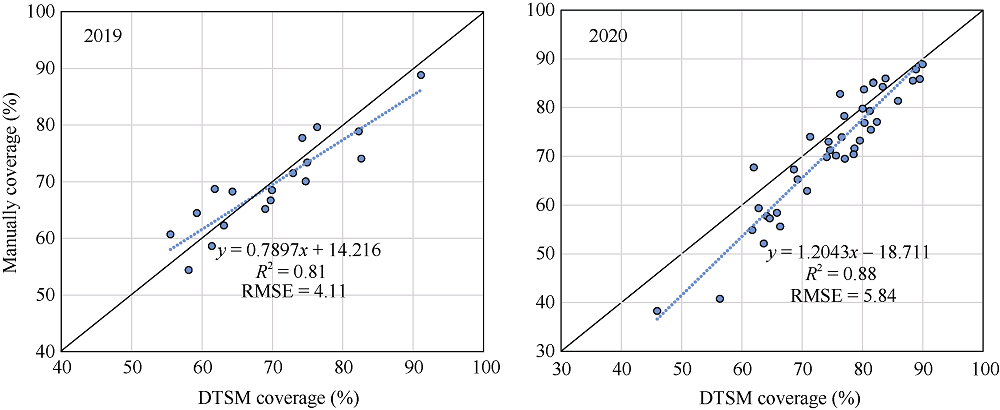
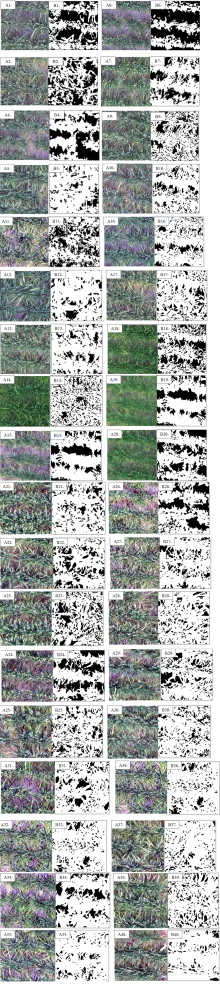
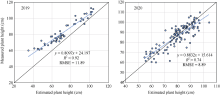
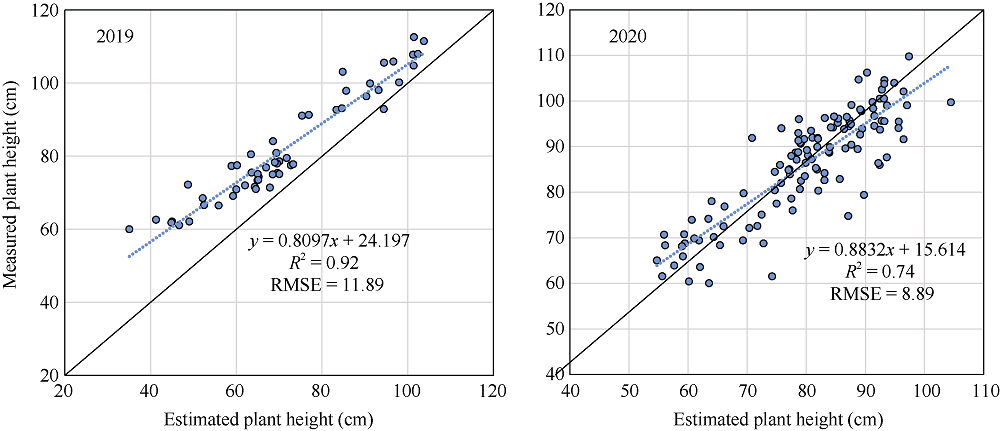
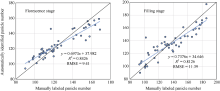
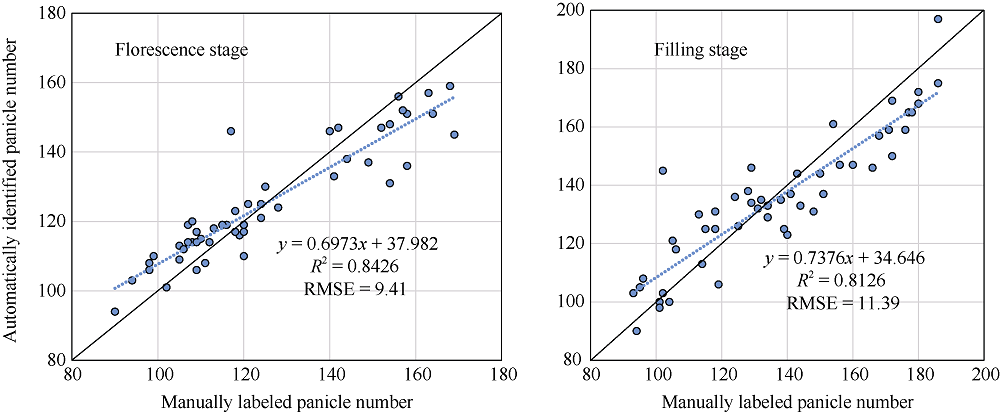
田间水稻表型监测可用于分析水稻产量相关性状, 对指导水稻栽培管理以及产量预测具有重要意义。本研究以3种氮肥处理下6个不同栽培品种的水稻为研究对象, 估测并评价了水稻冠层的主要表型参数, 以探讨利用图像分析方法评价多品种及栽培环境下田间水稻长势的适用性。基于无人机和田间固定相机图像, 本研究通过图像处理、三维建模和机器学习自动测算出田间水稻冠层覆盖度、株高、穗数, 并结合实际测量结果进行了精度评价。结果表明: (1) 基于无人机图像使用决策树分类模型提取的水稻冠层图像与人工勾绘结果一致性较好(Qseg均值为0.75, 方差为0.08), 由此计算的冠层覆盖度与人工勾绘计算的冠层覆盖度相关性较高(R2= 0.83, RMSE = 5.36%); (2) 使用冠层高度模型估测的各小区水稻株高均值与田间实测高度均值相关性较高(R2= 0.81, RMSE = 9.81 cm), 但整体呈现低估; (3) 基于地面图像使用决策树分类和形态参数过滤得到的穗数计数结果与实测穗数相关性较高(R2= 0.83, RMSE = 10.99)。总体而言, 结合图像分析算法, 应用低空无人机遥感技术高通量自动化估测水稻冠层覆盖度、株高的精度较高, 而应用地面平台进行稻穗精确识别的潜力很大, 可用于分析氮肥施用量对水稻长势指标的影响及不同品种对氮肥的响应情况, 对田间水稻表型信息的深入挖掘及实际产量预测具有重要意义。
| [1] | 段凌凤, 杨万能. 水稻表型组学研究概况和展望. 生命科学, 2016, 10:1129-1137. |
| Duan L F, Yang W N. Research advances and future scenarios of rice phenomics. Chin Bull Life Sci, 2016, 10:1129-1137 (in Chinese with English abstract). | |
| [2] | 朱德峰, 程式华, 张玉屏, 林贤青, 陈惠哲. 全球水稻生产现状与制约因素分析. 中国农业科学, 2010, 43:474-479. |
| Zhu D F, Cheng S H, Zhang Y P, Lin X Q, Chen H Z. Analysis of status and constraints of rice production in the world. Sci Agric Sin, 2010, 43:474-479 (in Chinese with English abstract). | |
| [3] | 彭永彬, 谢先芝. 表型组学在水稻研究中的应用. 中国水稻科学, 2020, 34:300-306. |
| Peng Y B, Xie X Z. Application of phenomics in rice research. Chin J Rice Sci, 2020, 34:300-304 (in Chinese with English abstract). | |
| [4] | 章曼. 基于高光谱遥感的水稻生长监测研究. 西北农林科技大学硕士学位论文, 陕西杨凌, 2015. |
| Zhang M. Based on Hyperspectral Remote Sensing of the Rice Growth Monitoring Research. MS Thesis of Northwest Agriculture and Forest University, Yangling, Shaanxi, China, 2015 (in Chinese with English abstract). | |
| [5] | Han L, Yang G J, Dai H Y, Xu B, Yang H, Feng H K, Li Z H, Yang X D. Modeling maize above-ground biomass based on machine learning approaches using UAV remote-sensing data. BioMed Central, 2019, 15:10. |
| [6] |
Busemeyer L, Mentrup D, Möller K, Wunder E, Alheit K, Hahn V, Maurer H, Reif J, Würschum T, Müller J, Rahe F, Ruckelshausen A. BreedVision—a multi-sensor platform for non-destructive field-based phenotyping in plant breeding. Sensors, 2013, 13:2830-2847.
doi: 10.3390/s130302830 pmid: 23447014 |
| [7] |
Walter A, Liebisch F, Hund A. Plant phenotyping: from bean weighing to image analysis. Plant Methods, 2015, 11:14.
doi: 10.1186/s13007-015-0056-8 pmid: 25767559 |
| [8] |
Jin X L, Liu S Y, Baret F, Hemerlé M, Comar A. Estimates of plant density of wheat crops at emergence from very low altitude UAV imagery. Remote Sens Environ, 2017, 198:105-114.
doi: 10.1016/j.rse.2017.06.007 |
| [9] | 张玉盛, 肖欢, 吴勇俊, 杨小粉, 汪泽钱, 伍湘, 向焱赟, 张小毅, 敖和军. 粒肥施用时期对水稻镉积累的影响初探. 华北农学报, 2020, 35(2):144-151. |
| Zhang Y S, Xiao H, Wu Y J, Yang X F, Wang Z Q, Wu X, Xiang Y B, Zhang X Y, Ao H J. Effect of application period of granular fertilizer on cadmium accumulation in rice. Acta Agric Boreali-Sin, 2020, 35(2):144-151 (in Chinese with English abstract). | |
| [10] | 韩焕豪, 崔远来, 时元智, 余双, 陈劲丰. SunScan冠层分析仪在水稻叶面积指数测量中的应用. 灌溉排水学报, 2015, 34(8):44-48. |
| Han H H, Cui Y L, Shi Y Z, Yu S, Chen J F. Application of SunScan canopy analysis system to measure leaf area index of rice. J Irrig Drain, 2015, 34(8):44-48 (in Chinese with English abstract). | |
| [11] |
Toshihiro S, Cao V P, Aikihiko K, Khang D N, Masayuki Y. Analysis of rapid expansion of inland aquaculture and triple rice-cropping areas in a coastal area of the Vietnamese Mekong Delta using MODIS time-series imagery. Landscape Urban Plan, 2009, 92:34-46.
doi: 10.1016/j.landurbplan.2009.02.002 |
| [12] |
Xiao X M, Boles S, Frolking S, Li C S, Jagadeesh Y.B, Salas W, Moore B. Mapping paddy rice agriculture in South and Southeast Asia using multi-temporal MODIS images. Remote Sens Environ, 2005, 100:95-113.
doi: 10.1016/j.rse.2005.10.004 |
| [13] |
Yang G J, Liu J G, Zhao C J, Li Z H, Huang Y B, Yu H Y, Xu B, Yang X D, Zhu D M, Zhang X Y, Zhang R Y, Feng H K, Zhao X Q, Li Z H, Li H L, Yang H. Unmanned aerial vehicle remote sensing for field-based crop phenotyping: current status and perspectives. Front Plant Sci, 2017, 8:1111.
doi: 10.3389/fpls.2017.01111 |
| [14] | 陈仲新, 郝鹏宇, 刘佳, 安萌, 韩波. 农业遥感卫星发展现状及我国监测需求分析. 智慧农业, 2019, 1(1):32-42. |
| Chen Z X, Hao P Y, Liu J, An M, Han B. Technical demands for agricultural remote sensing satellites in China. Smart Agric, 2019, 1(1):32-42 (in Chinese with English abstract). | |
| [15] | 汪沛, 罗锡文, 周志艳, 臧英, 胡炼. 罗基于微小型无人机的遥感信息获取关键技术综述. 农业工程学报, 2014, 30(18):1-12. |
| Wang P, Luo X W, Zhou Z Y, Zang Y, Hu L. Key technology for remote sensing information acquisition based on micro UAV. Trans CSAE, 2014, 30(18):1-12 (in Chinese with English abstract). | |
| [16] |
Desai S V, Balasubramanian V N, Fukatsu T, Ninomiya S, Guo W. Automatic estimation of heading date of paddy rice using deep learning. Plant Methods, 2019, 15:1-11.
doi: 10.1186/s13007-018-0385-5 |
| [17] | 丁国辉, 许昊, 温明星, 陈佳玮, 王秀娥. 基于经济型低空无人机对小麦重要产量表型性状的多生育时期获取和自动化分析. 农业大数据学报, 2019, 1(2):19-31. |
| Ding G H, Xu H, Wen M X, Chen J W, Wang X E. Developing cost-effective and low-altitude UAV aerial phenotyping and automated phenotypic analysis to measure key yield-related traits for bread wheat. J Agric Big Data, 2019, 1(2):19-31 (in Chinese with English abstract). | |
| [18] |
Guo W, Rage U K, Ninomiya S. Illumination invariant segmentation of vegetation for time series wheat images based on decision tree model. Comput Electron Agric, 2013, 96:58-66.
doi: 10.1016/j.compag.2013.04.010 |
| [19] |
Duan T, Zheng B Y, Guo W, Ninomiya S, Guo Y, Chapman S C. Comparison of ground cover estimates from experiment plots in cotton, sorghum and sugarcane based on images and ortho-mosaics captured by UAV. Funct Plant Biol, 2017, 44:169.
doi: 10.1071/FP16123 |
| [20] | 赵锋, 王克俭, 苑迎春. 基于颜色特征的AdaBoost算法的麦穗识别的研究. 作物杂志, 2014, (1):141-144. |
| Zhao F, Wang K J, Yuan Y C. Study on wheat spike identification based on color features and AdaBoost Algorithm. Crops, 2014, (1):141-144 (in Chinese with English abstract). | |
| [21] | Cointault F, Guerin D, Guillemin J-P, Chopinet B. In-field Triticum aestivum ear counting using colour-texture image analysis. New Zeal J Crop Hortic, 2008, 36:117-130. |
| [22] |
Zhou C Q, Liang D, Yang X D, Yang H, Yue J B, Yang G J. Wheat ears counting in field conditions based on multi-feature optimization and TWSVM. Front Plant Sci, 2018, 9:1024.
doi: 10.3389/fpls.2018.01024 |
| [23] |
Fernandez-Gallego J A, Kefauver S C, Gutiérrez N A, Nieto- Taladriz M T, Araus J L. Wheat ear counting in-field conditions: high throughput and low-cost approach using RGB images. Plant Methods, 2018, 14:22.
doi: 10.1186/s13007-018-0289-4 pmid: 29568319 |
| [24] |
Xiong X, Duan L F, Liu L B, Tu H F, Yang P, Wu D, Chen G X, Xiong L Z, Yang W N, Liu Q. Panicle-SEG: a robust image segmentation method for rice panicles in the field based on deep learning and superpixel optimization. Plant Methods, 2017, 13:104.
doi: 10.1186/s13007-017-0254-7 pmid: 29209408 |
| [25] | Olsen P A, Ramamurthy K N, Ribera J, Chen Y H, Thompson A M, Luss R, Tuinstra M, Abe N. Detecting and counting panicles in sorghum images. The 5th IEEE International Conference on Data Science and Advanced Analytics, Turin, Italy, 2018. |
| [26] | 段凌凤, 熊雄, 刘谦, 杨万能, 黄成龙. 基于深度全卷积神经网络的大田稻穗分割. 农业工程学报, 2018, 34(12):202-209. |
| Duan L F, Xiong X, Liu Q, Yang W N, Huang C L. Field rice panicles segmentation based on deep full convolutional neural network. Trans CSAE, 2018, 34(12):202-209 (in Chinese with English abstract) | |
| [27] | 黄国祥. RGB颜色空间及其应用研究. 中南大学博士学位论文, 湖南长沙, 2002. |
| Huang G X. RGB Color Space and It’s Application. PhD Dissertation of Central South University, Changsha, Hunan, China, 2002 (in Chinese with English abstract). | |
| [28] | 秦绪佳, 王慧玲, 杜轶诚, 郑红波, 梁震华. Hsv色彩空间的retinex结构光图像增强算法. 计算机辅助设计与图形学学报, 2013, 25:488-493. |
| Qin X J, Wang H L, Du Y C, Zheng H B, Liang Z H. Structured light image enhancement algorithm based on Retinex in HSV color space. J Comp-Aied Desig Comp Grap, 2013, 25:488-493. | |
| [29] | 张宏建. Lab色彩模式在图像处理中的应用. 福建电脑, 2011, 27(1):146-147. |
| Zhang H J. Application of Lab color mode in image processing. J Fujian Comput, 2011, 27(1):146-147 (in Chinese with English abstract). | |
| [30] |
Guo W, Zheng B Y, Duan T, Fukatsu T, Chapman S C, Ninomiya S. EasyPCC: benchmark datasets and tools for high-throughput measurement of the plant canopy coverage ratio under field conditions. Sensors, 2017, 17:798.
doi: 10.3390/s17040798 |
| [31] |
Guo W, Zheng B Y, Potgieter A B, Diot J, Watanabe K, Noshita K, Jordan D R, Wang X M, Watson J, Ninomiya S, Chapman S C. Aerial imagery analysis-quantifying appearance and number of sorghum heads for applications in breeding and agronomy. Front Plant Sci, 2018, 9:1544.
doi: 10.3389/fpls.2018.01544 |
| [32] | 段凌凤. 水稻植株穗部性状在体测量研究. 华中科技大学博士学位论文, 湖北武汉, 2013. |
| Duan L F. Panicle Traits Measurement of Rice Plant in vivo. PhD Dissertation of Huazhong University of Science and Technology, Wuhan, Hubei, China, 2013 (in Chinese with English abstract). | |
| [33] | 王秀娟, 康孟珍, 华净, de Reffye P. 从群体到个体尺度—基于数据的DSSAT和GreenLab作物模型连接探索. 智慧农业, 2021, 3(2):77-87. |
| Wang X J, Kang M Z, Hua J, de Reffye P. From stand to organ level: a trial of connecting DSSAT and GreenLab crop model through data. Smart Agric, 2021, 3(2):77-87 (in Chinese with English abstract) | |
| [34] |
Bouman B, Keulen H V, Laar H, Rabbinge R. The ‘School of de Wit’ crop growth simulation models: a pedigree and historical overview. Agric Syst, 1996, 52:171-198.
doi: 10.1016/0308-521X(96)00011-X |
| [35] |
Woebbecke D M, Meyer G E, Bargen K V, Mortensen D A. Color indices for weed identification under various soil, residue, and lighting conditions. Trans ASAE, 1995, 38:259-269.
doi: 10.13031/2013.27838 |
| [36] |
Meyer G E, Neto J C. Verification of color vegetation indices for automated crop imaging applications. Comput Electron Agric, 2008, 63:282-293.
doi: 10.1016/j.compag.2008.03.009 |
| [37] |
Burgos-Artizzu X P, Ribeiro A, Guijarro M, Pajares G. Real-time image processing for crop/weed discrimination in maize fields. Comput Electron Agric, 2011, 75:337-346.
doi: 10.1016/j.compag.2010.12.011 |
| [38] |
Pérez A J, López F, Benlloch J V, Christensen S. Colour and shape analysis techniques for weed detection in cereal fields. Comput Elect Agric, 2000, 25:197-212.
doi: 10.1016/S0168-1699(99)00068-X |
| [39] | 李存军. 基于数字照片特征的小麦覆盖度自动提取研究. 浙江大学学报(农业与生命科学版), 2004, 30(6):64-70. |
| Li C J. Study on automatic extraction of wheat coverage based on digital photo features. J Zhejiang Univ(Agric Life Sci Edn), 2004, 30(6):64-70 (in Chinese with English abstract). | |
| [40] |
Lukina E V, Stone M L, Raun W R. Estimating vegetation coverage in wheat using digital images. J Plant Nutr, 1999, 22:341-350.
doi: 10.1080/01904169909365631 |
| [41] | 计野. 无人机遥感图像内部畸变校正算法及应用研究. 电子科技大学博士学位论文, 四川成都, 2010. |
| Ji Y. Research on Internal Distortion Correction Algorithm and Application of UAV Remote Sensing Image. PhD Dissertation of University of Electronic Science and Technology of China, Chengdu, Sichuan, China, 2010 (in Chinese with English abstract). | |
| [42] |
Weng J, Cohen P. Camera calibration with distortion models and accuracy evaluation. Patt Anal Mach Intell IEEE Trans, 1992, 14:965-980.
doi: 10.1109/34.159901 |
| [43] | 牛庆林, 冯海宽, 杨贵军, 李长春, 杨浩, 徐波. 基于无人机数码影像的玉米育种材料株高和LAI监测. 农业工程学报, 2018, 34(5):73-82. |
| Niu Q L, Feng H K, Yang G J, Li C C, Yang H, Xu B. Monitoring plant height and leaf area index of maize breeding material based on UAV digital images. Trans CSAE, 2018, 34(5):73-82 (in Chinese with English abstract). | |
| [44] | 胡鹏程. 基于无人机近感的高通量田间作物几何表型研究. 中国农业大学博士学位论文, 北京, 2018. |
| Hu P C. High-throughput Field Morphological Phenotyping using UAV-based Proximal Sensing. PhD Dissertation of China Agricultural University, Beijing, China, 2018 (in Chinese with English abstract). | |
| [45] | 姜海燕, 徐灿, 陈尧, 成永康. 基于田间图像的局部遮挡小尺寸稻穗检测和计数方法. 农业机械学报, 2020, 51(9):152-162. |
| Jiang H Y, Xu C, Chen Y, Cheng Y K. A detecting and counting method for small-sized and occluded rice panicles based on in-field images. Trans CSAM, 2020, 51(9):152-162 (in Chinese with English abstract). | |
| [46] |
Madec S, Jin X, Lu H, Solan B D, Liu S, Duyme F. Ear density estimation from high resolution RGB imagery using deep learning technique. Agric For Meteorol, 2019, 264:225-234.
doi: 10.1016/j.agrformet.2018.10.013 |
| [47] |
Xiong H, Cao Z, Lu H, Madec S, Shen C. TasselNetv2: in-field counting of wheat spikes with context-augmented local regression networks. Plant Methods, 2019, 15:150.
doi: 10.1186/s13007-019-0537-2 |
| [1] | 唐宽强, 李公允, 宋美毅, 赵雪, 常春玲. 大豆株高性状全基因组关联分析及预测模型构建[J]. 作物学报, 2026, 52(6): 1743-1756. |
| [2] | 郭绪虎, 李灵芝, 李凤, 马博岩, 贾晓宇. I型MADS-box基因SlMADS79调控番茄株型的功能研究[J]. 作物学报, 2025, 51(4): 982-991. |
| [3] | 徐建霞, 丁延庆, 曹宁, 程斌, 高旭, 李文贞, 张立异. 中国高粱株高和节间数全基因组关联分析及候选基因预测[J]. 作物学报, 2025, 51(3): 568-585. |
| [4] | 赵海红, 李梦媛, 刘锦婧, 王园园, 杜磊, 王娟, 董承光, 李成奇. 利用3VmrMLM方法检测陆地棉株高QTN及QTN-环境互作(QEI)[J]. 作物学报, 2025, 51(10): 2619-2631. |
| [5] | 刘薇, 王玉斌, 李伟, 张礼凤, 徐冉, 王彩洁, 张彦威. 过量表达大豆异丙基苹果酸脱氢酶基因GmIPMDH促进植株开花和生长[J]. 作物学报, 2024, 50(3): 613-622. |
| [6] | 刁现民, 王立伟, 智慧, 张俊, 李顺国, 程汝宏. 谷子中矮秆资源创制、遗传解析和育种利用[J]. 作物学报, 2024, 50(2): 265-279. |
| [7] | 阳世杰, 王华智, 潘怡敏, 黄蕊, 侯森, 秦慧彬, 穆志新, 王海岗. 山西谷子种质资源株高全基因组关联分析[J]. 作物学报, 2024, 50(12): 2984-2997. |
| [8] | 赵阳, 李龙, 杨进文, 景蕊莲, 孙黛珍, 王景一. 小麦E3泛素连接酶基因TaSINA-3A与多种环境下的株高和千粒重相关[J]. 作物学报, 2024, 50(10): 2654-2664. |
| [9] | 杨晨曦, 周文期, 周香艳, 刘忠祥, 周玉乾, 刘芥杉, 杨彦忠, 何海军, 王晓娟, 连晓荣, 李永生. 控制玉米株高基因PHR1的基因克隆[J]. 作物学报, 2024, 50(1): 55-66. |
| [10] | 朱治, 李龙, 李超男, 毛新国, 郝晨阳, 朱婷, 王景一, 常建忠, 景蕊莲. 小麦转录因子TaMYB5-3B与株高和千粒重相关[J]. 作物学报, 2023, 49(4): 906-916. |
| [11] | 马雅杰, 鲍建喜, 高悦欣, 李雅楠, 秦文萱, 王彦博, 龙艳, 李金萍, 董振营, 万向元. 玉米株高和穗位高性状全基因组关联分析[J]. 作物学报, 2023, 49(3): 647-661. |
| [12] | 赵蝶, 胡文静, 程晓明, 王书平, 张春梅, 李东升, 高德荣. 扬麦4号/偃展1号RIL群体株高QTL挖掘及其对赤霉病抗性的效应分析与验证[J]. 作物学报, 2023, 49(12): 3215-3226. |
| [13] | 委刚, 陈单阳, 任德勇, 杨宏霞, 伍靖雯, 冯萍, 王楠. 水稻细长秆突变体sr10的鉴定与基因定位[J]. 作物学报, 2022, 48(8): 2125-2133. |
| [14] | 胡文静, 李东升, 裔新, 张春梅, 张勇. 小麦穗部性状和株高的QTL定位及育种标记开发和验证[J]. 作物学报, 2022, 48(6): 1346-1356. |
| [15] | 于春淼, 张勇, 王好让, 杨兴勇, 董全中, 薛红, 张明明, 李微微, 王磊, 胡凯凤, 谷勇哲, 邱丽娟. 栽培大豆×半野生大豆高密度遗传图谱构建及株高QTL定位[J]. 作物学报, 2022, 48(5): 1091-1102. |
|
||