欢迎访问作物学报,今天是

作物学报 ›› 2018, Vol. 44 ›› Issue (9): 1274-1289.doi: 10.3724/SP.J.1006.2018.01274

• 研究论文 • 上一篇    下一篇

限制性两阶段多位点全基因组关联分析方法的特点与计算程序

贺建波(),刘方东,邢光南,王吴彬,赵团结,管荣展,盖钧镒()   

  1. 南京农业大学大豆研究所 / 农业部大豆生物学与遗传育种重点实验室 / 国家大豆改良中心 / 作物遗传与种质创新国家重点实验室, 江苏南京 210095
  • 收稿日期:2018-03-19 接受日期:2018-06-12 出版日期:2018-09-10 网络出版日期:2018-06-29
  • 通讯作者: 盖钧镒
  • 基金资助:
    本研究由国家自然科学基金项目(31701447);本研究由国家自然科学基金项目(31671718);国家重点研发计划项目(2017YFD0101500);国家重点研发计划项目((2017YFD0101500));教育部111项目(B08025)(PCSIRT_17R55);教育部长江学者和创新团队项目(PCSIRT_17R55)(CARS-04);国家现代农业产业技术体系建设专项(CARS-04)

Characterization and Analytical Programs of the Restricted Two-stage Multi- locus Genome-wide Association Analysis

Jian-Bo HE(),Fang-Dong LIU,Guang-Nan XING,Wu-Bin WANG,Tuan-Jie ZHAO,Rong-Zhan GUAN,Jun-Yi GAI()   

  1. Soybean Research Institute / National Center for Soybean Improvement, Ministry of Agriculture / Key Laboratory of Biology and Genetic Improvement of Soybean (General), Ministry of Agriculture / State Key Laboratory for Crop Genetics and Germplasm Enhancement, Nanjing Agricultural University, Nanjing 210095, Jiangsu, China
  • Received:2018-03-19 Accepted:2018-06-12 Published:2018-09-10 Published online:2018-06-29
  • Contact: Jun-Yi GAI
  • Supported by:
    This study was supported by the National Natural Science Foundation of China(31701447);This study was supported by the National Natural Science Foundation of China(31671718);National Key R&D Program for Crop Breeding in China(2017YFD0101500);National Key R&D Program for Crop Breeding in China the MOE 111 Project B08025((2017YFD0101500));MOE Program for Changjiang Scholars and Innovative Research Team in University(PCSIRT_17R55);China Agriculture Research System(CARS-04);the Jiangsu Higher Education PAPD Program, the Fundamental Research Funds for the Central Universities and the Jiangsu JCIC-MCP(CARS-04)

摘要:

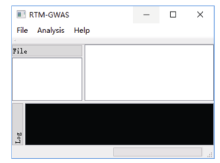
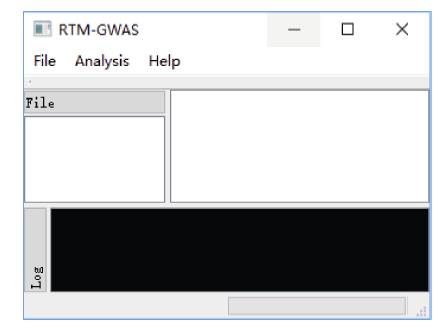
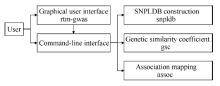
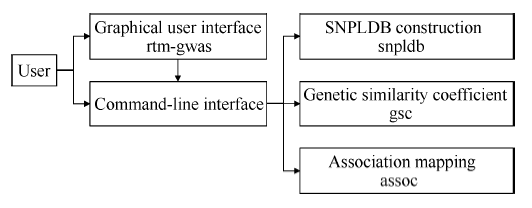
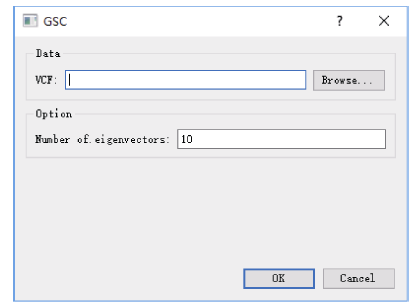
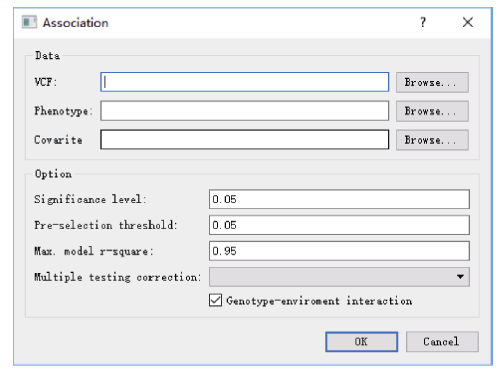
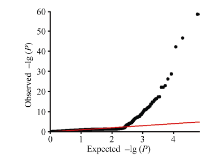
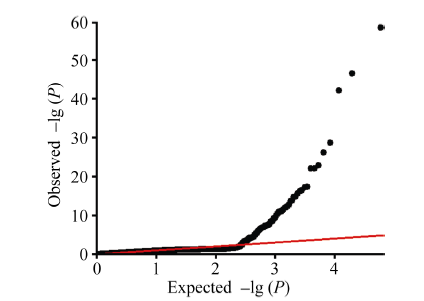
全基因组关联分析(genome-wide association study, GWAS)的理论及应用是近十几年来国内外数量性状研究的热点, 但是以往GWAS方法注重于个别主要QTL/基因的检测与发掘。为了相对全面地解析全基因组QTL及其等位基因构成, 本研究提出了限制性两阶段多位点GWAS方法(RTM-GWAS, https://github.com/njau-sri/rtm-gwas)。RTM-GWAS首先将多个相邻且紧密连锁的SNP分组, 成为具有多个单倍型(复等位变异)的连锁不平衡区段(SNPLDB)标记, 然后采用两阶段分析策略, 基于多位点复等位变异遗传模型, 在节省计算空间的条件下保障全基因组QTL及其复等位变异检出的精确度。和以往GWAS方法相比, RTM-GWAS以性状遗传率为上限, 能够较充分地检测出QTL及其相应的复等位变异并能有效地控制假阳性的膨胀。由其结果建立的QTL-allele矩阵代表了群体中所研究性状的全部遗传组成。依据这种QTL-allele矩阵的信息, 可以设计最优基因型的遗传组成, 预测群体中最优化的杂交组合, 并用以进行群体遗传和特有与新生等位变异的研究。本研究首先对RTM-GWAS方法的特点和计算程序功能进行说明, 然后通过大豆试验数据说明RTM-GWAS计算程序的使用方法。

关键词: 限制性两阶段多位点全基因组关联分析, 连锁不平衡区段, 多位点模型, QTL-allele矩阵, 种质资源群体, 优化组合设计

Abstract:

Genome-wide association studies (GWAS) have been widely used for genetic dissection of quantitative trait loci (QTL), and the previous GWAS procedures were concentrated on finding a handful of major loci, while the plant breeders are more likely interested in exploring the whole QTL system for both forward selection and background control. We proposed the restricted two-stage multi-locus genome-wide association analysis (RTM-GWAS, https://github.com/njau-sri/rtm-gwas/) for a relatively thorough detection of QTL and their multiple alleles. Firstly, RTM-GWAS groups the tightly linked sequential SNPs into linkage disequilibrium blocks (SNPLDBs) to form genomic markers with multiple haplotypes as alleles. Secondly, it utilizes two-stage association analysis based on a multi-locus multi-allele model to save computer space for focusing on genome-wide QTL identification along with their multiple alleles. Compared with the previous GWAS methods, RTM-GWAS takes the trait heritability as the upper limit of detected genetic contribution, which can avoid a large amount of false positives for a precise detection of the QTL system of the trait. The QTL-allele matrix as a compact form of the population genetic constitution can be used to design optimal genotypes, to predict optimal crosses in plant breeding, and to study the genetic properties of the population as well as the novel and newly emerged alleles. In the present study, we first introduced the function and usage of the RTM-GWAS analytical programs, and then used the experimental data from a research program on soybean to illustrate the application details of the RTM-GWAS.

Key words: restricted two-stage multi-locus genome-wide association study, SNP linkage disequilibrium block, multi-locus model, QTL-allele matrix, germplasm population, optimal cross design

图1

RTM-GWAS方法计算程序图形用户界面"

图2

RTM-GWAS方法计算程序构架斜体文字为相应功能的二进制程序名称。"

图3

表型数据文件格式 Indiv表示个体/材料名称列名; SW、OC、PR为性状名称; NaN表示缺失值。"

图4

SNPLDB标记构建对话框 VCF指以VCF格式存储的基因型数据文件路径; Min.: 最小值; Max.: 最大值; CI: 置信区间。"

图5

遗传相似系数计算对话框 VCF指以VCF格式存储的基因型数据文件路径。"

图6

关联分析功能对话框 VCF指以VCF格式存储的基因型数据文件路径; Max.: 最大值; r-square: 模型决定系数。"

图7

大豆株高全基因组关联分析Q-Q图"

表1

大豆株高显著关联的大效应SNPLDB标记位点"

SNPLDB 染色体
Chromosome
位置
Position
Model a QTL QTL×Env. b
-lg P -lg P R2 (%) -lg P R2 (%)
LDB_19_44964630 19 44964630-45029584 58.26 206.01 7.361 52.86 1.693
LDB_6_44183574 6 44183574-44281248 46.46 199.50 7.359 11.64 0.495
LDB_16_8004288 16 8004288-8203845 42.01 171.86 6.140 6.15 0.280
LDB_13_11539212 13 11539212-11625990 28.64 120.36 4.091 0.66 0.053
LDB_17_36474880 17 36474880-36494652 22.81 96.33 3.229 0.80 0.059
LDB_4_37782684 4 37782684-37923093 22.06 83.36 2.809 3.39 0.170
LDB_8_7075139 8 7075139-7077091 26.19 81.67 2.616 16.09 0.505
LDB_3_26698545 3 26698545-26898267 17.24 68.85 2.423 4.56 0.261
LDB_15_16773982 15 16773982-16774010 22.09 72.65 2.273 5.22 0.154
LDB_16_28838874 16 28838874-28868118 16.44 56.11 1.887 1.01 0.077
LDB_4_11093449 4 11093449-11192120 13.61 51.18 1.800 3.13 0.195
LDB_2_5863888 2 5863888-5979031 14.88 47.63 1.493 1.06 0.042
LDB_16_7494681 16 7494681 16.21 48.32 1.440 1.04 0.018
LDB_1_50277902 1 50277902 17.34 47.47 1.413 8.98 0.239
LDB_14_2467475 14 2467475 15.57 45.66 1.356 0.88 0.014
LDB_4_29936477 4 29936477-29950803 14.74 38.98 1.217 5.63 0.186
LDB_3_22147965 3 22147965-22342699 11.98 32.08 1.209 11.34 0.516
LDB_7_20253563 7 20253563-20451607 13.83 36.68 1.174 2.68 0.108
LDB_14_46095634 14 46095634-46106570 12.67 35.50 1.076 0.28 0.008
LDB_3_8197776 3 8197776-8202466 11.51 32.01 1.026 1.05 0.052
LDB_6_22108685 6 22108685-22191360 10.97 28.35 1.004 5.03 0.241

图8

大豆株高全基因组关联分析Manhattan图"

图9

大豆株高主效QTL-allele矩阵数据文件行表示104个主效显著的株高关联位点, 列表示723份栽培大豆材料, 数据为104×723的主效位点等位基因效应矩阵。"

图10

大豆株高QTL-allele可视化矩阵"

图11

株高性状所有亲本组合后代预测结果文件 P1、P2分别表示单交组合的2个亲本; MEAN、SD分别表示组合纯合后代群体株高平均数和标准差; P10、P50、P90分别表示组合纯合后代群体株高第10、第50、第90百分位数。"

图12

株高性状所有亲本组合后代预测结果可视化虚线表示亲本群体株高变异范围(15~165 cm)。"

附表1

大豆株高显著关联的SNPLDB标记位点"

SNPLDB 染色体
Chromosome
位置
Position
Model a QTL QTL×Env. b
-lg P -lg P R2 (%) -lg P R2 (%)
LDB_19_44964630 19 44964630-45029584 58.26 206.01 7.361 52.86 1.693
LDB_6_44183574 6 44183574-44281248 46.46 199.50 7.359 11.64 0.495
LDB_16_8004288 16 8004288-8203845 42.01 171.86 6.140 6.15 0.280
LDB_13_11539212 13 11539212-11625990 28.64 120.36 4.091 0.66 0.053
LDB_17_36474880 17 36474880-36494652 22.81 96.33 3.229 0.80 0.059
LDB_4_37782684 4 37782684-37923093 22.06 83.36 2.809 3.39 0.170
LDB_8_7075139 8 7075139-7077091 26.19 81.67 2.616 16.09 0.505
LDB_3_26698545 3 26698545-26898267 17.24 68.85 2.423 4.56 0.261
LDB_15_16773982 15 16773982-16774010 22.09 72.65 2.273 5.22 0.154
LDB_16_28838874 16 28838874-28868118 16.44 56.11 1.887 1.01 0.077
LDB_4_11093449 4 11093449-11192120 13.61 51.18 1.800 3.13 0.195
LDB_2_5863888 2 5863888-5979031 14.88 47.63 1.493 1.06 0.042
LDB_16_7494681 16 7494681 16.21 48.32 1.440 1.04 0.018
LDB_1_50277902 1 50277902 17.34 47.47 1.413 8.98 0.239
LDB_14_2467475 14 2467475 15.57 45.66 1.356 0.88 0.014
LDB_4_29936477 4 29936477-29950803 14.74 38.98 1.217 5.63 0.186
LDB_3_22147965 3 22147965-22342699 11.98 32.08 1.209 11.34 0.516
LDB_7_20253563 7 20253563-20451607 13.83 36.68 1.174 2.68 0.108
LDB_14_46095634 14 46095634-46106570 12.67 35.50 1.076 0.28 0.008
LDB_3_8197776 3 8197776-8202466 11.51 32.01 1.026 1.05 0.052
LDB_6_22108685 6 22108685-22191360 10.97 28.35 1.004 5.03 0.241
LDB_6_1271502 6 1271502-1275159 12.04 32.96 0.997 0.61 0.018
LDB_12_34374105 12 34374105 12.35 32.82 0.956 0.40 0.005
LDB_5_27543725 5 27543725-27547377 11.25 27.31 0.851 1.50 0.056
LDB_5_4082209 5 4082209-4121721 10.60 26.74 0.834 2.20 0.079
LDB_4_16641482 4 16641482-16839772 8.72 22.21 0.786 2.84 0.150
LDB_19_39240844 19 39240844-39276967 11.01 23.49 0.759 5.16 0.188
LDB_5_15648588 5 15648588 10.85 25.48 0.731 0.14 0.001
LDB_4_12429588 4 12429588-12605113 9.93 20.00 0.715 6.46 0.276
LDB_9_45791340 9 45791340 10.33 22.42 0.638 0.56 0.008
LDB_3_36428638 3 36428638-36469336 8.56 19.15 0.624 1.44 0.066
LDB_16_2807415 16 2807415-2827492 9.48 17.29 0.588 6.02 0.231
SNPLDB 染色体
Chromosome
位置
Position
Model a QTL QTL×Env. b
-lg P -lg P R2 (%) -lg P R2 (%)
LDB_11_35694247 11 35694247-35698584 9.13 18.50 0.553 0.30 0.009
LDB_7_35303124 7 35303124-35327231 7.34 15.83 0.542 1.43 0.076
LDB_15_12007768 15 12007768-12011501 7.68 16.51 0.492 0.18 0.005
LDB_7_32985427 7 32985427-33184712 6.68 13.54 0.489 0.74 0.057
LDB_2_3911388 2 3911388-3928107 7.14 14.07 0.466 1.34 0.062
LDB_9_20673268 9 20673268-20692609 6.87 13.82 0.436 0.33 0.016
LDB_16_1151749 16 1151749 9.34 15.53 0.432 4.63 0.115
LDB_19_44669655 19 44669655-44754287 8.40 13.62 0.430 7.17 0.233
LDB_5_907001 5 907001-907042 7.84 15.21 0.423 0.13 0.001
LDB_9_8062600 9 8062600-8116659 6.60 11.79 0.374 1.12 0.044
LDB_8_19152075 8 19152075-19152100 7.48 13.34 0.367 0.92 0.015
LDB_10_5777915 10 5777915-5798626 7.46 10.73 0.362 5.67 0.204
LDB_19_44550587 19 44550587-44558289 7.30 11.07 0.352 3.42 0.117
LDB_20_34089188 20 34089188 7.57 12.42 0.340 1.11 0.020
LDB_5_2803587 5 2803587 6.90 12.30 0.336 0.35 0.004
LDB_8_16373446 8 16373446-16420876 4.96 10.50 0.334 0.32 0.016
LDB_18_57452705 18 57452705-57457239 6.26 10.95 0.325 0.33 0.010
LDB_7_25096830 7 25096830 6.89 11.75 0.320 0.36 0.004
LDB_9_38183930 9 38183930-38268800 5.66 7.74 0.319 4.07 0.194
LDB_12_9936416 12 9936416-9994538 4.45 8.40 0.307 0.79 0.050
LDB_3_33432777 3 33432777-33462071 6.40 9.52 0.305 1.19 0.046
LDB_5_1382138 5 1382138 6.66 10.46 0.283 0.70 0.010
LDB_6_33023321 6 33023321 6.03 10.09 0.272 0.39 0.004
LDB_11_35162270 11 35162270 7.31 10.07 0.271 5.10 0.128
LDB_18_27478142 18 27478142 6.16 10.06 0.271 0.46 0.006
LDB_17_33708118 17 33708118-33815088 7.03 7.77 0.251 6.96 0.226
LDB_5_38350041 5 38350041-38432356 6.76 7.19 0.233 5.51 0.182
LDB_11_6370581 11 6370581-6486015 5.64 6.03 0.231 3.87 0.161
LDB_16_31959033 16 31959033-31999963 4.27 7.11 0.231 0.46 0.021
LDB_18_44942878 18 44942878-45064511 3.28 5.38 0.225 0.48 0.044
LDB_2_12669763 2 12669763-12684207 4.48 5.69 0.204 1.20 0.057
LDB_6_41523578 6 41523578 5.41 7.71 0.203 0.81 0.013
LDB_17_15782164 17 15782164-15845977 3.22 3.92 0.189 0.78 0.066
LDB_4_42809656 4 42809656-42809670 5.27 5.79 0.171 2.76 0.081
LDB_9_25244209 9 25244209 4.20 6.56 0.170 0.20 0.002
LDB_3_43245339 3 43245339 4.91 6.56 0.170 0.25 0.002
LDB_15_9202681 15 9202681 5.40 6.24 0.160 3.37 0.079
LDB_20_3498125 20 3498125-3691528 4.33 3.82 0.159 2.93 0.129
LDB_17_11367127 17 11367127-11382009 3.93 4.76 0.159 1.85 0.068
LDB_17_32520275 17 32520275-32552871 3.03 2.75 0.147 1.72 0.107
LDB_16_32918946 16 32918946 4.25 5.59 0.142 1.19 0.022
LDB_12_3456148 12 3456148 4.19 5.44 0.137 1.63 0.033
LDB_8_6056566 8 6056566 5.03 5.37 0.136 1.85 0.038
LDB_4_9550687 4 9550687-9550998 5.03 4.57 0.135 3.77 0.111
SNPLDB 染色体
Chromosome
位置
Position
Model a QTL QTL×Env. b
-lg P -lg P R2 (%) -lg P R2 (%)
LDB_5_2285265 5 2285265-2285296 3.31 4.50 0.133 1.00 0.030
LDB_15_27523398 15 27523398-27723343 3.84 3.02 0.132 3.47 0.147
LDB_13_4599736 13 4599736 3.30 4.78 0.119 0.10 0.000
LDB_9_10672160 9 10672160-10831207 5.87 4.01 0.118 6.77 0.200
LDB_1_50652928 1 50652928-50669137 3.70 2.97 0.117 2.84 0.113
LDB_18_52669179 18 52669179 3.92 4.71 0.117 1.55 0.031
LDB_6_18845190 6 18845190 3.30 4.49 0.111 1.13 0.020
LDB_13_17681170 13 17681170 3.51 4.26 0.104 0.25 0.002
LDB_4_15008106 4 15008106-15030261 2.72 2.85 0.099 1.58 0.059
LDB_20_39556580 20 39556580 2.34 3.88 0.094 0.61 0.009
LDB_16_20099141 16 20099141 2.27 3.87 0.093 0.18 0.001
LDB_14_20541667 14 20541667 3.05 3.80 0.091 0.56 0.008
LDB_15_3242880 15 3242880 8.41 3.74 0.090 13.78 0.380
LDB_1_52750312 1 52750312 2.93 3.72 0.089 0.25 0.002
LDB_16_21247996 16 21247996 3.85 3.59 0.085 1.90 0.040
LDB_3_28458666 3 28458666 2.67 3.26 0.076 0.89 0.015
LDB_18_3933946 18 3933946 3.53 3.14 0.073 1.65 0.033
LDB_7_15901391 7 15901391-15903281 4.33 2.93 0.067 4.15 0.101
LDB_19_2090261 19 2090261-2090611 4.43 2.92 0.067 4.40 0.108
LDB_7_27922333 7 27922333-28121779 3.45 1.47 0.067 3.33 0.129
LDB_5_41679020 5 41679020 4.15 2.90 0.067 3.78 0.091
LDB_18_57497434 18 57497434-57500329 3.29 2.79 0.064 1.07 0.019
LDB_4_571693 4 571693 2.40 2.63 0.059 1.66 0.034
LDB_6_46436793 6 46436793-46436833 2.30 2.56 0.057 1.05 0.018
LDB_20_32314703 20 32314703 3.45 2.40 0.053 2.98 0.069
LDB_8_42752500 8 42752500 4.23 2.40 0.053 3.74 0.090
LDB_4_43757706 4 43757706 2.86 2.40 0.053 2.38 0.052
LDB_11_31994374 11 31994374-31994436 2.28 2.31 0.051 0.76 0.012
LDB_4_1643625 4 1643625-1744093 2.39 1.65 0.049 3.06 0.090
LDB_16_8204099 16 8204099 2.68 2.08 0.044 1.63 0.033
LDB_13_33478164 13 33478164 2.85 1.79 0.037 3.21 0.075
LDB_14_48799491 14 48799491-48799496 4.12 1.20 0.035 4.55 0.134
LDB_7_16630442 7 16630442 3.58 1.55 0.031 3.76 0.090
LDB_3_5207322 3 5207322 4.23 1.45 0.028 4.94 0.123
LDB_7_23869970 7 23869970 3.28 1.26 0.024 3.41 0.081
LDB_1_3351751 1 3351751 3.42 0.89 0.015 3.41 0.081
LDB_7_30278846 7 30278846 4.23 0.60 0.008 6.12 0.157
LDB_1_24895878 1 24895878 2.40 0.36 0.004 3.14 0.073
Total 114 104 c 78.103 51 d 10.312

附表2

高杆大豆育种化组合设计"

亲本 Parent 组合 Cross
P1 P2 Y1 Y2 平均数 Mean 标准差 SD P10 P50 P90
4L060 4L311 136.3 132.3 135.4 36.1 87.5 135.5 183.3
4L119 4L361 125.0 138.6 132.3 37.2 81.6 131.8 182.2
4L213 4L361 127.6 138.6 133.5 35.9 84.4 134.4 181.3
4L060 4L119 136.3 125.0 130.6 37.4 80.5 130.3 180.8
4L054 4L060 133.5 136.3 134.6 33.4 91.3 133.7 180.8
4L311 4L361 132.3 138.6 134.3 35.2 87.7 134.4 180.7
4L054 4L361 133.5 138.6 136.3 33.6 92.8 135.3 180.7
4L060 4L371 136.3 137.2 138.0 32.5 93.9 138.8 180.5
4L361 4L371 138.6 137.2 136.9 32.4 93.6 137.8 179.4
4L060 4L213 136.3 127.6 131.7 36.0 83.4 132.1 179.3
4L159 4L361 143.6 138.6 141.2 28.9 103.5 141.6 179.1
4L060 4L297 136.3 131.0 133.9 33.4 90.5 132.6 178.9
4L060 4L159 136.3 143.6 140.3 29.5 101.2 140.2 178.9
4L361 4L367 138.6 136.5 138.2 29.8 99.7 137.6 178.6
4L234 4L361 132.0 138.6 134.8 31.6 93.8 134.1 177.8
4L297 4L361 131.0 138.6 134.3 33.0 91.6 134.1 177.5
4L054 4L114 133.5 128.3 131.9 33.7 85.5 131.6 177.0
4L274 4L361 131.5 138.6 135.4 31.5 92.5 135.8 176.4
4L114 4L371 128.3 137.2 133.7 32.3 90.0 133.8 176.3
4L114 4L311 128.3 132.3 129.4 35.7 81.8 128.1 176.0
4L114 4L213 128.3 127.6 128.2 35.9 79.9 127.9 175.5
4L060 4L367 136.3 136.5 136.2 30.8 94.1 136.8 175.4
4L114 4L159 128.3 143.6 136.1 29.8 97.8 135.9 175.4
4L060 4L274 136.3 131.5 133.6 31.4 91.7 134.1 175.3
4L060 4L148 136.3 124.2 130.7 33.6 87.2 130.2 175.1
4L114 4L119 128.3 125.0 125.6 37.7 74.1 125.6 175.0
4L248 4L361 123.4 138.6 131.0 33.4 86.9 131.0 174.6
4L114 4L297 128.3 131.0 129.0 35.0 83.7 128.9 174.6
4L193 4L361 122.8 138.6 131.5 33.1 88.3 130.9 173.7
4L060 4L234 136.3 132.0 132.7 31.7 90.2 133.4 173.6
4L114 4L234 128.3 132.0 131.0 32.2 89.0 131.0 173.3
4L114 4L367 128.3 136.5 133.1 30.6 92.8 133.0 173.3
4L027 4L361 118.0 138.6 128.0 33.2 84.9 127.6 173.2
4L060 4L193 136.3 122.8 129.3 32.7 85.5 129.4 172.8
4L060 4L248 136.3 123.4 128.6 33.2 84.6 128.8 172.5
4L260 4L361 107.0 138.6 124.3 36.2 77.5 123.5 172.3
4L060 4L302 136.3 115.0 125.1 33.3 80.6 124.1 172.1
4L302 4L361 115.0 138.6 126.3 34.4 82.0 125.7 172.0
4L060 4L111 136.3 115.0 126.7 33.8 81.9 126.2 171.9
4L315 4L361 120.4 138.6 130.4 31.9 88.3 130.9 171.8
4L148 4L361 124.2 138.6 130.8 31.6 89.7 130.6 171.6
4L111 4L361 115.0 138.6 126.5 33.8 81.7 126.8 171.5
4L146 4L361 112.8 138.6 126.5 33.2 83.2 125.4 171.5
亲本 Parent 组合 Cross
P1 P2 Y1 Y2 平均数 Mean 标准差 SD P10 P50 P90
4L049 4L361 110.6 138.6 124.6 35.7 79.0 125.1 171.3
4B181 4L361 118.2 138.6 128.5 32.0 86.4 128.9 171.3
4L283 4L361 106.2 138.6 120.8 37.4 72.2 120.4 171.2
4L060 4L315 136.3 120.4 128.8 31.8 85.9 129.0 171.2
4L114 4L274 128.3 131.5 130.6 31.1 89.6 131.5 171.2
4L284 4L361 114.2 138.6 126.8 33.7 82.1 127.0 170.9
4L114 4L193 128.3 122.8 125.6 33.7 81.4 124.3 170.6
4L027 4L060 118.0 136.3 126.1 33.7 82.1 125.4 170.6
4B181 4L060 118.2 136.3 128.0 32.2 84.9 128.2 170.6
4L060 4L284 136.3 114.2 126.0 34.5 80.1 126.7 170.5
4L060 4L112 136.3 119.2 127.2 32.0 85.0 126.9 170.5
4L112 4L361 119.2 138.6 128.5 31.2 87.3 128.0 170.4
4L242 4L361 117.6 138.6 128.4 31.5 85.9 128.3 170.0
4L191 4L361 92.4 138.6 114.9 40.7 60.0 114.9 169.8
4L124 4L361 106.0 138.6 122.9 35.0 77.1 122.5 169.7
4L114 4L248 128.3 123.4 126.4 33.4 82.9 125.3 169.6
4L145 4L361 119.6 138.6 127.9 30.9 86.3 127.6 169.5
4L049 4L060 110.6 136.3 123.3 35.8 76.8 123.6 169.5
4L060 4L145 136.3 119.6 128.5 31.2 86.5 128.2 169.4
4L001 4L361 120.8 138.6 129.7 30.1 90.4 128.9 169.4
4L201 4L361 106.2 138.6 122.8 35.1 76.0 121.8 169.2
4L060 4L260 136.3 107.0 121.8 36.2 74.3 121.4 169.1
4L154 4L361 118.3 138.6 128.4 31.6 86.4 128.3 168.9
4L352 4L361 112.0 138.6 125.9 31.7 85.1 125.4 168.8
4L022 4L159 71.5 143.6 108.7 45.7 48.7 109.2 168.8
4L224 4L361 109.6 138.6 123.7 33.5 79.6 124.1 168.8
4L186 4L361 113.6 138.6 126.7 31.2 85.4 125.7 168.7
4L254 4L361 110.2 138.6 124.4 33.6 78.5 124.2 168.6
4L060 4L154 136.3 118.3 127.4 31.1 87.1 127.2 168.5
4L276 4L361 102.3 138.6 120.1 35.8 72.4 119.9 168.5
4L001 4L060 120.8 136.3 129.2 30.0 90.0 128.9 168.4
4L060 4L242 136.3 117.6 125.6 31.9 83.3 124.4 168.3
4B181 4L114 118.2 128.3 124.3 32.8 81.6 124.5 168.3
4L022 4L060 71.5 136.3 104.6 46.7 43.0 103.2 168.1
4L060 4L254 136.3 110.2 122.3 34.1 76.5 122.7 168.0
4L114 4L148 128.3 124.2 125.6 32.6 83.0 125.6 168.0
4L060 4L146 136.3 112.8 124.0 32.6 80.4 123.9 167.8
4L296 4L361 121.5 138.6 129.3 29.2 91.3 129.3 167.8
4L060 4L191 136.3 92.4 114.7 40.0 61.9 115.2 167.8
4L060 4L283 136.3 106.2 120.1 35.7 73.3 120.7 167.7
4L114 4L284 128.3 114.2 122.2 33.7 77.5 121.6 167.5
4L060 4L352 136.3 112.0 124.3 32.7 80.7 123.9 167.5
4L060 4L201 136.3 106.2 120.4 34.6 75.5 120.1 167.2
4L042 4L361 115.5 138.6 127.1 30.5 85.9 127.3 167.1
亲本 Parent 组合 Cross
P1 P2 Y1 Y2 平均数 Mean 标准差 SD P10 P50 P90
4L060 4L276 136.3 102.3 119.8 35.8 72.2 120.2 167.0
4L114 4L315 128.3 120.4 125.2 31.7 82.0 125.9 167.0
4L027 4L114 118.0 128.3 123.4 33.0 80.7 123.9 166.8
4L114 4L260 128.3 107.0 117.4 37.3 69.0 116.9 166.7
4L060 4L186 136.3 113.6 124.2 31.4 83.9 123.2 166.6
4L049 4L114 110.6 128.3 120.2 35.2 74.5 120.4 166.6
4L361 4L369 138.6 112.4 125.4 30.9 84.6 125.0 166.4
4L022 4L054 71.5 133.5 103.9 47.9 40.6 104.9 166.4
4L042 4L060 115.5 136.3 126.3 30.1 85.9 126.1 166.2
4L117 4L361 117.0 138.6 128.3 28.5 91.6 127.2 166.2
4L111 4L114 115.0 128.3 122.1 34.2 76.7 122.1 166.2
4L060 4L124 136.3 106.0 120.4 34.5 75.6 120.6 166.2
4L360 4L361 111.0 138.6 124.3 31.3 82.8 125.6 166.1
4L107 4L361 119.4 138.6 128.8 28.6 90.0 129.7 166.0
[1] Visscher P M, Wray N R, Zhang Q, Sklar P , McCarthy M I, Brown M A, Yang J . 10 Years of GWAS discovery: biology, function, and translation. Am J Hum Genet, 2017,101:5-22
[2] Pritchard J K, Stephens M, Rosenberg N A, Donnelly P . Association mapping in structured populations. Am J Hum Genet, 2000,67:170-181
doi: 10.1086/302959 pmid: 10827107
[3] Price A L, Patterson N J, Plenge R M, Weinblatt M E, Shadick N A, Reich D . Principal components analysis corrects for stratification in genome-wide association studies. Nat Genet, 2006,38:904-909
[4] Yu J, Pressoir G, Briggs W H, Vroh Bi I, Yamasaki M, Doebley J F , McMullen M D, Gaut B S, Nielsen D M, Holland J B, Kresovich S, Buckler E S. A unified mixed-model method for association mapping that accounts for multiple levels of relatedness. Nat Genet, 2006,38:203-208
[5] Kang H M, Zaitlen N A, Wade C M, Kirby A, Heckerman D, Daly M J, Eskin E . Efficient control of population structure in model organism association mapping. Genetics, 2008,178:1709-1723
doi: 10.1534/genetics.107.080101 pmid: 18385116
[6] Kang H M, Sul J H, Service S K, Zaitlen N A, Kong S Y, Freimer N B, Sabatti C, Eskin E . Variance component model to account for sample structure in genome-wide association studies. Nat Genet, 2010,42:348-354
doi: 10.1038/ng.548 pmid: 20208533
[7] Zhang Z, Ersoz E, Lai C Q, Todhunter R J, Tiwari H K, Gore M A, Bradbury P J, Yu J, Arnett D K, Ordovas J M, Buckler E S . Mixed linear model approach adapted for genome-wide association studies. Nat Genet, 2010,42:355-360
doi: 10.1038/ng.546 pmid: 20208535
[8] Pritchard J K, Stephens M, Donnelly P . Inference of population structure using multilocus genotype data. Genetics, 2000,155:945-959
pmid: 10835412
[9] Alexander D H, Novembre J, Lange K . Fast model-based estimation of ancestry in unrelated individuals. Genome Res, 2009,19:1655-1664
[10] Atwell S, Huang Y S, Vilhjalmsson B J, Willems G, Horton M, Li Y, Meng D, Platt A, Tarone A M, Hu T T, Jiang R, Muliyati N W, Zhang X, Amer M A, Baxter I, Brachi B, Chory J, Dean C , Debieu M, de Meaux J, Ecker J R, Faure N, Kniskern J M, Jones J D, Michael T, Nemri A, Roux F, Salt D E, Tang C, Todesco M, Traw M B, Weigel D, Marjoram P, Borevitz J O, Bergelson J, Nordborg M . Genome-wide association study of 107 phenotypes in Arabidopsis thaliana inbred lines. Nature, 2010,465:627-631
[11] Huang X, Wei X, Sang T, Zhao Q, Feng Q, Zhao Y, Li C, Zhu C, Lu T, Zhang Z, Li M, Fan D, Guo Y, Wang A, Wang L, Deng L, Li W, Lu Y, Weng Q, Liu K, Huang T, Zhou T, Jing Y, Li W, Lin Z, Buckler E S, Qian Q, Zhang Q F, Li J, Han B . Genome-wide association studies of 14 agronomic traits in rice landraces. Nat Genet, 2010,42:961-967
doi: 10.1038/ng.695 pmid: 20972439
[12] Li H, Peng Z, Yang X, Wang W, Fu J, Wang J, Han Y, Chai Y, Guo T, Yang N, Liu J, Warburton M L, Cheng Y, Hao X, Zhang P, Zhao J, Liu Y, Wang G, Li J, Yan J . Genome-wide association study dissects the genetic architecture of oil biosynthesis in maize kernels. Nat Genet, 2013,45:43-50
[13] Fang C, Ma Y M, Wu S W, Liu Z, Wang Z, Yang R, Hu G H, Zhou Z K, Yu H, Zhang M, Pan Y, Zhou G A, Ren H X, Du W Q, Yan H R, Wang Y P, Han D Z, Shen Y T, Liu S L, Liu T F, Zhang J X, Qin H, Yuan J, Yuan X H, Kong F J, Liu B H, Li J Y, Zhang Z W, Wang G D, Zhu B G, Tian Z X . Genome-wide association studies dissect the genetic networks underlying agronomical traits in soybean. Genome Biol, 2017,18:161
[14] Peleman J D , van der Voort J R. Breeding by design. Trends Plant Sci, 2003,8:330-334
[15] Huang X, Wei X, Sang T, Zhao Q, Feng Q, Zhao Y, Li C, Zhu C, Lu T, Zhang Z, Li M, Fan D, Guo Y, Wang A, Wang L, Deng L, Li W, Lu Y, Weng Q, Liu K, Huang T, Zhou T, Jing Y, Li W, Lin Z, Buckler E S, Qian Q, Zhang Q F, Li J, Han B . Genome-wide association studies of 14 agronomic traits in rice landraces. Nat Genet, 2010,42:961-967
doi: 10.1038/ng.695 pmid: 20972439
[16] Zhao K, Tung C W, Eizenga G C, Wright M H, Ali M L, Price A H, Norton G J, Islam M R, Reynolds A, Mezey J , McClung A M, Bustamante C D, McCouch S R . Genome-wide association mapping reveals a rich genetic architecture of complex traits in Oryza sativa. Nat Commun, 2011,2:467
[17] Zeng Z B . Precision mapping of quantitative trait loci. Genetics, 1994,136:1457-1468
doi: 10.1007/s00122-012-2032-2. pmid: 8013918
[18] He J, Meng S, Zhao T, Xing G, Yang S, Li Y, Guan R, Lu J, Wang Y, Xia Q, Yang B, Gai J . An innovative procedure of genome-wide association analysis fits studies on germplasm population and plant breeding. Theor Appl Genet, 2017,130:2327-2343
[19] Zhang Y, He J, Wang Y, Xing G, Zhao J, Li Y, Yang S, Palmer R G, Zhao T, Gai J . Establishment of a 100-seed weight quantitative trait locus-allele matrix of the germplasm population for optimal recombination design in soybean breeding programmes. J Exp Bot, 2015,66:6311-6325
[20] Meng S, He J, Zhao T, Xing G, Li Y, Yang S, Lu J, Wang Y, Gai J . Detecting the QTL-allele system of seed isoflavone content in Chinese soybean landrace population for optimal cross design and gene system exploration. Theor Appl Genet, 2016,129:1557-1576
[21] Li S, Cao Y, He J, Zhao T, Gai J . Detecting the QTL-allele system conferring flowering date in a nested association mapping population of soybean using a novel procedure. Theor Appl Genet, 2017,130:2297-2314
[22] Gabriel S B, Schaffner S F, Nguyen H, Moore J M, Roy J, Blumenstiel B, Higgins J , DeFelice M, Lochner A, Faggart M, Liu-Cordero S N, Rotimi C, Adeyemo A, Cooper R, Ward R, Lander E S, Daly M J, Altshuler D . The structure of haplotype blocks in the human genome. Science, 2002,296:2225-2229
[23] Patterson N, Price A L, Reich D . Population structure and eigenanalysis. PLoS Genet, 2006,2:e190
[24] Price A L, Patterson N J, Plenge R M, Weinblatt M E, Shadick N A, Reich D . Principal components analysis corrects for stratification in genome-wide association studies. Nat Genet, 2006,38:904-909
[25] VanRaden P M . Efficient methods to compute genomic predictions. J Dairy Sci, 2008,91:4414-4423
doi: 10.3168/jds.2007-0980 pmid: 18946147
[26] Scheet P, Stephens M . A fast and flexible statistical model for large-scale population genotype data: applications to inferring missing genotypes and haplotypic phase. Am J Hum Genet, 2006,78:629-644
[27] Buckler E S, Holland J B, Bradbury P J, Acharya C B, Brown P J, Browne C, Ersoz E, Flint-Garcia S, Garcia A, Glaubitz J C, Goodman M M, Harjes C, Guill K, Kroon D E, Larsson S, Lepak N K, Li H, Mitchell S E, Pressoir G, Peiffer J A, Rosas M O, Rocheford T R, Romay M C, Romero S, Salvo S , Sanchez Villeda H, da Silva H S, Sun Q, Tian F, Upadyayula N, Ware D, Yates H, Yu J, Zhang Z, Kresovich S, McMullen M D. The genetic architecture of maize flowering time. Science, 2009,325:714-718
doi: 10.1126/science.1174276 pmid: 19661422
[28] Meuwissen T H, Hayes B J, Goddard M E . Prediction of total genetic value using genome-wide dense marker maps. Genetics, 2001,157:1819-1829
doi: 10.1017/S0016672301004931 pmid: 11290733
[1] 冯建英,温阳俊,张瑾,章元明. 植物关联分析方法的研究进展[J]. 作物学报, 2016, 42(07): 945-956.
Viewed
Full text


Abstract

Cited

  Shared   
  Discussed   
No Suggested Reading articles found!