Welcome to Acta Agronomica Sinica,

Acta Agronomica Sinica ›› 2026, Vol. 52 ›› Issue (10): 3054-3068.doi: 10.3724/SP.J.1006.2026.61026

• TILLAGE & CULTIVATION·PHYSIOLOGY & BIOCHEMISTRY • Previous Articles     Next Articles

Estimation of leaf nitrogen concentration in winter wheat based on an improved successive projections algorithm and continuous wavelet transform

Fu Yuan-Yuan1,2(), Li Shuai-Feng1, Chen Ke1, Xia Tian1, Feng Hai-Kuan3, Shu Mei-Yan1,2, Guo Wei1,2, Qiao Hong-Bo1, Yue Ji-Bo1,2,*()   

  1. 1 College of Artificial Intelligence, Henan Agricultural University, Zhengzhou 450046, Henan, China
    2 Henan International Joint Laboratory of Agricultural Big Data and Artificial Intelligence, Zhengzhou 450046, Henan, China
    3 Information Technology Research Center, Beijing Academy of Agriculture and Forestry Sciences, Beijing 100097, China
  • Received:2026-03-25 Accepted:2026-07-21 Online:2026-10-12 Published:2026-07-22
  • Contact: * Yue Ji-Bo, E-mail: yuejibo@henau.edu.cn
  • Supported by:
    General Program of the Natural Science Foundation of Henan Province(252300421853)

Abstract:

Remote sensing-based diagnosis of crop leaf nitrogen concentration (LNC) is of great importance for guiding precise nitrogen application, improving nitrogen use efficiency, and increasing crop yield. To address the limitations of the traditional successive projections algorithm (SPA) in handling nonlinear relationships among spectral features, this study proposes an improved successive projections algorithm, namely the kernel successive projections algorithm (KSPA). Continuous wavelet transform (CWT) was used for multi-scale spectral decomposition, and KSPA was subsequently applied to extract key features associated with LNC. For comparison, vegetation indices, SPA, and partial least squares-variable importance in projection (PLS-VIP) were also used for feature selection. Models based on partial least squares regression (PLSR), random forest (RF), and categorical boosting (CatBoost) were constructed to estimate winter wheat LNC, and Shapley additive explanations (SHAP) were used for model interpretability analysis. The results showed that intermediate CWT decomposition scales performed well in estimating winter wheat LNC, and the features selected by KSPA significantly improved model performance. The CatBoost model combined with KSPA at the seventh CWT scale achieved the best performance (R2 = 0.829, RMSE = 0.322%, RPD = 2.425). Compared with the best models based on PLS-VIP (RF: R2 = 0.729, RMSE = 0.405%) and SPA (CatBoost: R2 = 0.731, RMSE = 0.403%), this model increased R2 by 0.100 and 0.098 and reduced RMSE by 0.083% and 0.081%, respectively. Leave-one-year-out cross-validation further confirmed the robustness and generalization ability of the proposed method. Overall, the improved algorithm effectively overcomes the linear limitations of traditional SPA in feature selection and provides a useful reference for precision monitoring of nitrogen nutrition in winter wheat.

Key words: winter wheat leaf nitrogen concentration, continuous wavelet transform, kernel successive projections algorithm, categorical boosting, SHAP analysis

Table 1

Descriptive statistics of winter wheat leaf nitrogen concentration"

指标Index 所有数据All data 建模集Calibration set 验证集Validation set
样本数Sample 533 408 125
最大值Maximum value (%) 5.07 5.07 4.84
最小值Minimum value (%) 1.09 1.09 1.59
平均值 Mean (%) 3.11 3.08 3.18
标准差Standard deviation (%) 0.87 0.89 0.78
变异系数Coefficient of variation (%) 27.97 28.90 24.53
峰值Kurtosis (%) 2.13 2.09 2.14

Table 2

Vegetation indices and calculation formulas"

植被指数Vegetation index 计算公式Calculation formula
三角植被指数Triangular vegetation index (TVI) [17] R705/(R717+R491)
角度不敏感植被指数Angle insensitive vegetation index (AIVI) [18] [R445× (R720+R735)-R573× (R720-R735)]/[R720× (R573+R445)]
LIC指数Lightness index for chlorophyll (LIC) [19] R440/R690
改进型归一化差分705指数
Modified normalized difference 705 index (mND705) [20]
(R750-R705)/(R750+R705-2×R445)
归一化色素叶绿素指数
Normalized pigment chlorophyll index (NPCI) [21]
(R680-R430)/(R680+R430)
卡特指数Carter index (CTR) [18] R695/R420
归一化差分植被指数
Normalized difference vegetation index (NDVI) [22]
(R731-R709)/(R731+R709)
比值指数Ratio index (RI) [21] R735/R720
归一化差分705指数Normalized difference 705 index (ND705) [21] (R750-R705)/(R750+R705)
光化学反射指数Photochemical reflectance index (PRI) [21] (R570-R531)/(R570+R531)
陆地叶绿素指数MERIS terrestrial chlorophyll index (MTCI) [23] (R754-R709)/(R709-R681)
沃格尔曼红边指数Vogelmann red edge index (VOG) [21] R740/R720
简单比值色素指数Simple ratio pigment index (SRPI) [21] R430/R680
改进型红边简单比值指数
Modified simple ratio 705 index (mSR705) [23]
(R750-R445)/(R705-R445)
简单比值指数Simple ratio index (SR) [24] R712/R758

Table 3

Accuracy of winter wheat LNC prediction models based on raw spectral data and vegetation indices"

特征
Feature
模型
Model
建模集Calibration set 验证集Validation set
R2 RMSE (%) RPD R2 RMSE (%) RPD
原始光谱Original spectrum PLSR 0.712 0.477 1.864 0.600 0.491 1.588
RF 0.799 0.399 2.231 0.504 0.547 1.425
CatBoost 0.730 0.462 1.926 0.592 0.496 1.573
植被指数Vegetation index PLSR 0.624 0.545 1.633 0.627 0.475 1.643
RF 0.735 0.457 1.946 0.661 0.453 1.723
CatBoost 0.777 0.419 2.120 0.695 0.429 1.817

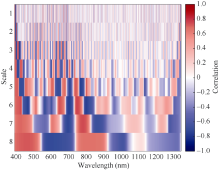
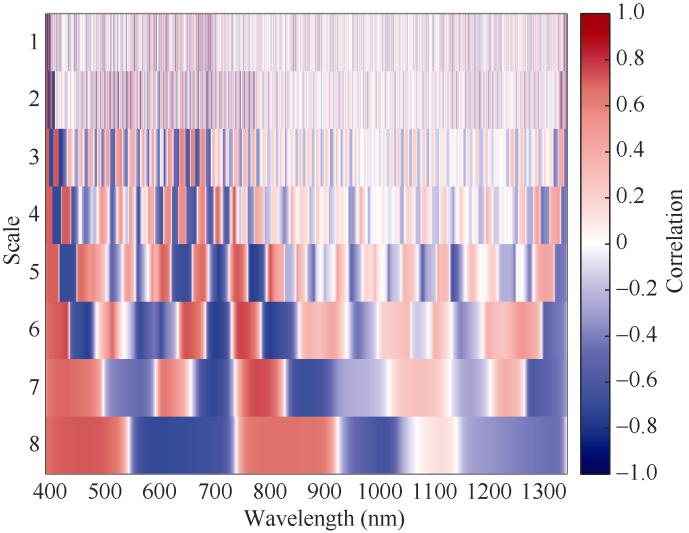
Fig. 1

Correlation coefficient matrix between wavelet coefficients and LNC at different CWT decomposition scales LNC: leaf nitrogen concentration; CWT: continuous wavelet transform."

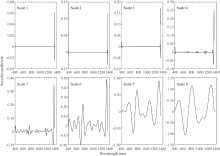
Fig. 2

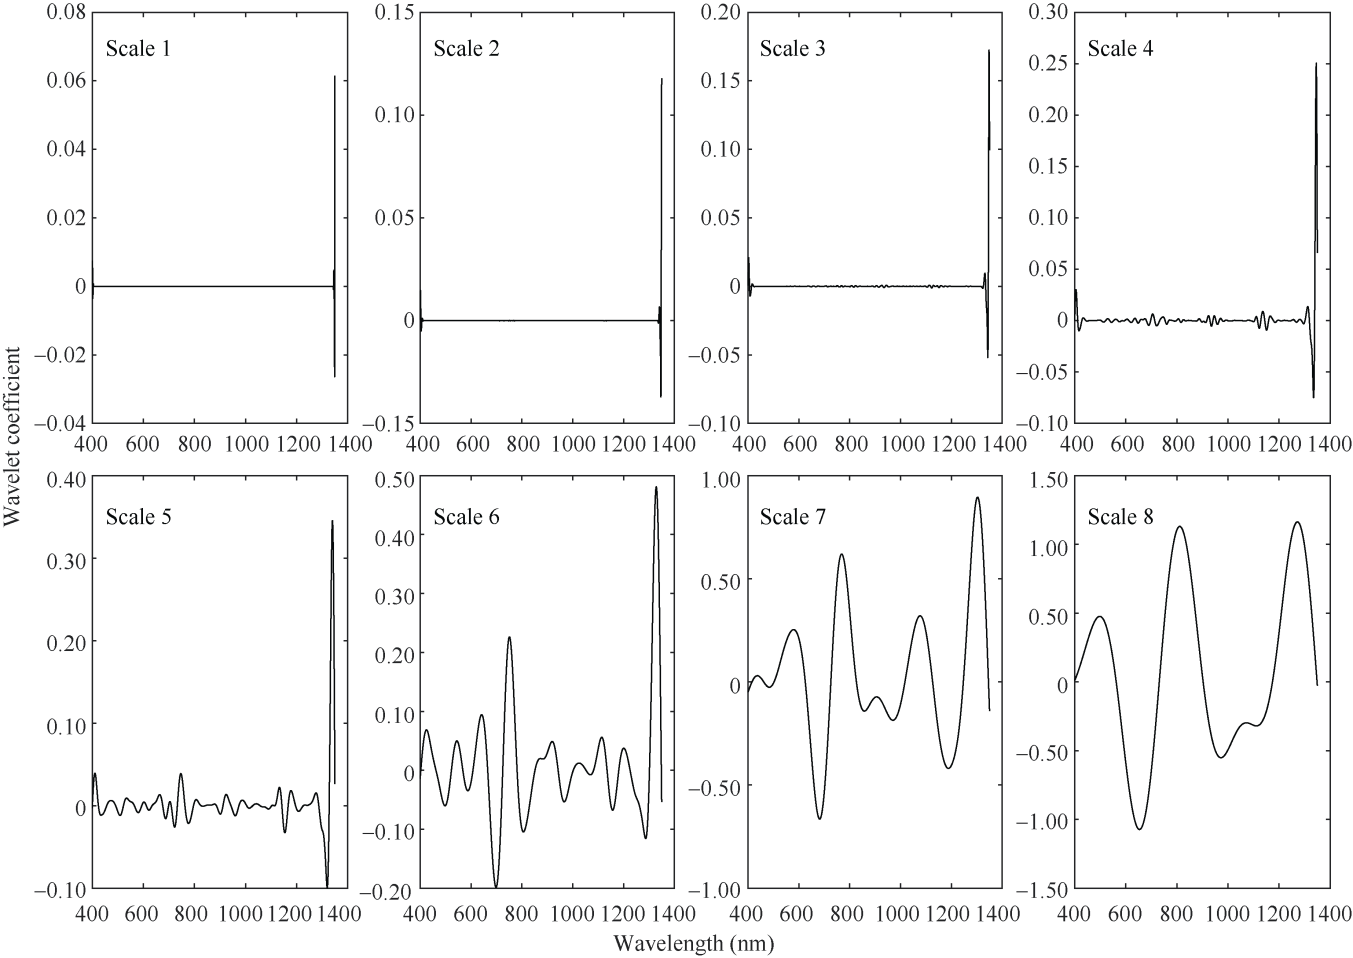
Wavelet coefficient curves at different CWT decomposition scales CWT: continuous wavelet transform."

Table 4

Number of wavelet coefficients selected by PLS-VIP, SPA, and KSPA at different CWT decomposition scales"

方法
Method
尺度4
Scale 4
尺度5
Scale 5
尺度6
Scale 6
尺度7
Scale 7
尺度8
Scale 8
原始光谱Original spectrum 951 951 951 951 951
偏最小二乘-变量投影重要性PLS-VIP 32 34 32 26 44
连续投影算法SPA 40 37 26 39 32
核化连续投影算法KSPA 52 49 63 68 56

Fig. 3

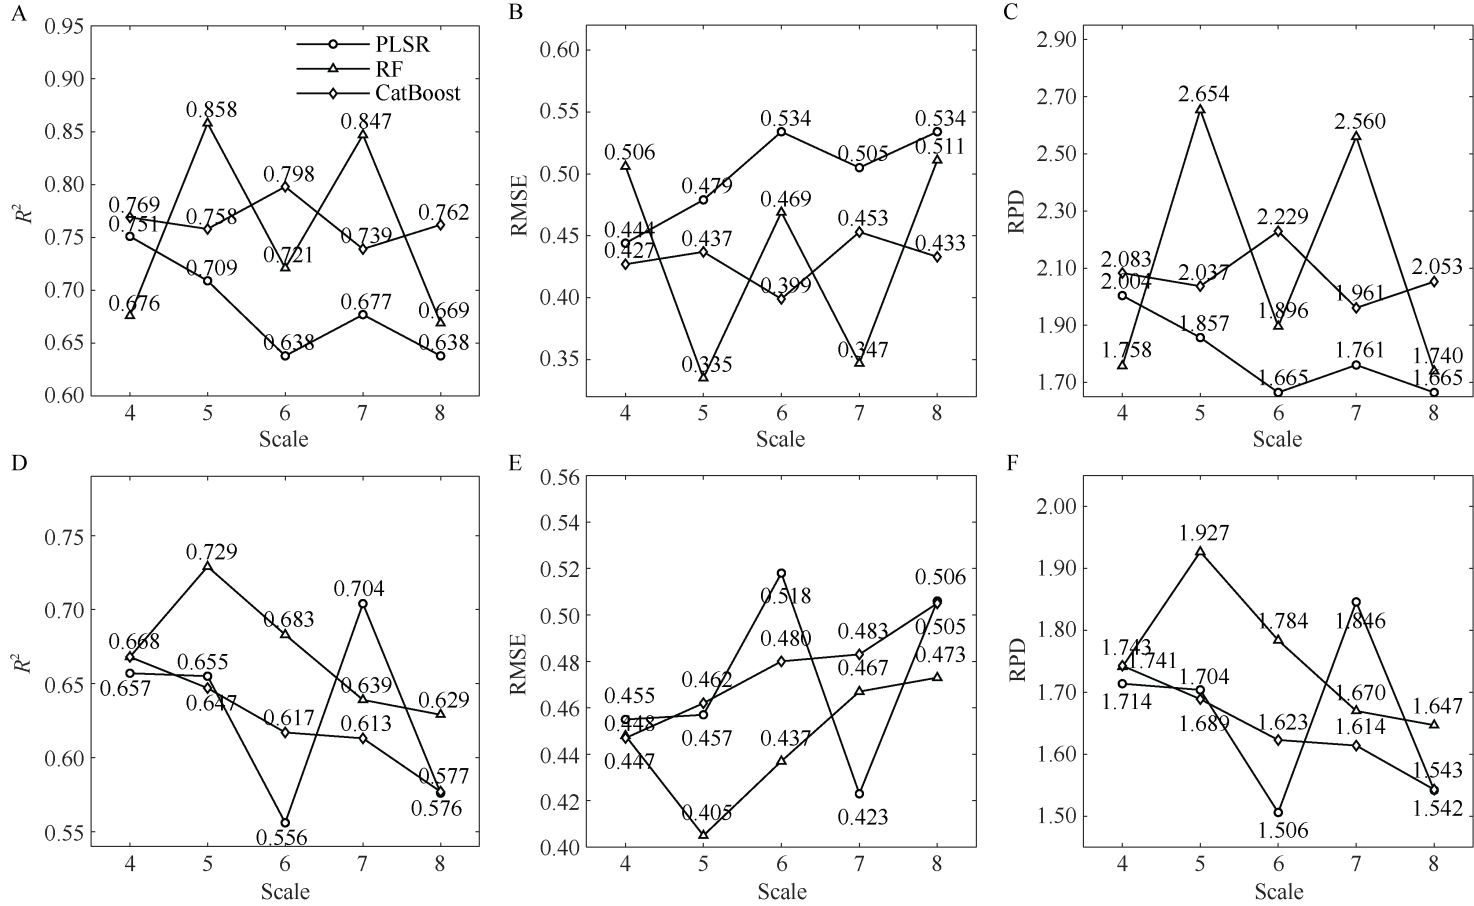
Accuracy of winter wheat LNC estimation models integrating different CWT scales and PLS-VIP A-C show the variation curves of R2, RMSE, and RPD for the calibration set, and D-F show those for the validation set. Abbreviations are the same as those given in Table 3 and Table 4."

Fig. 4

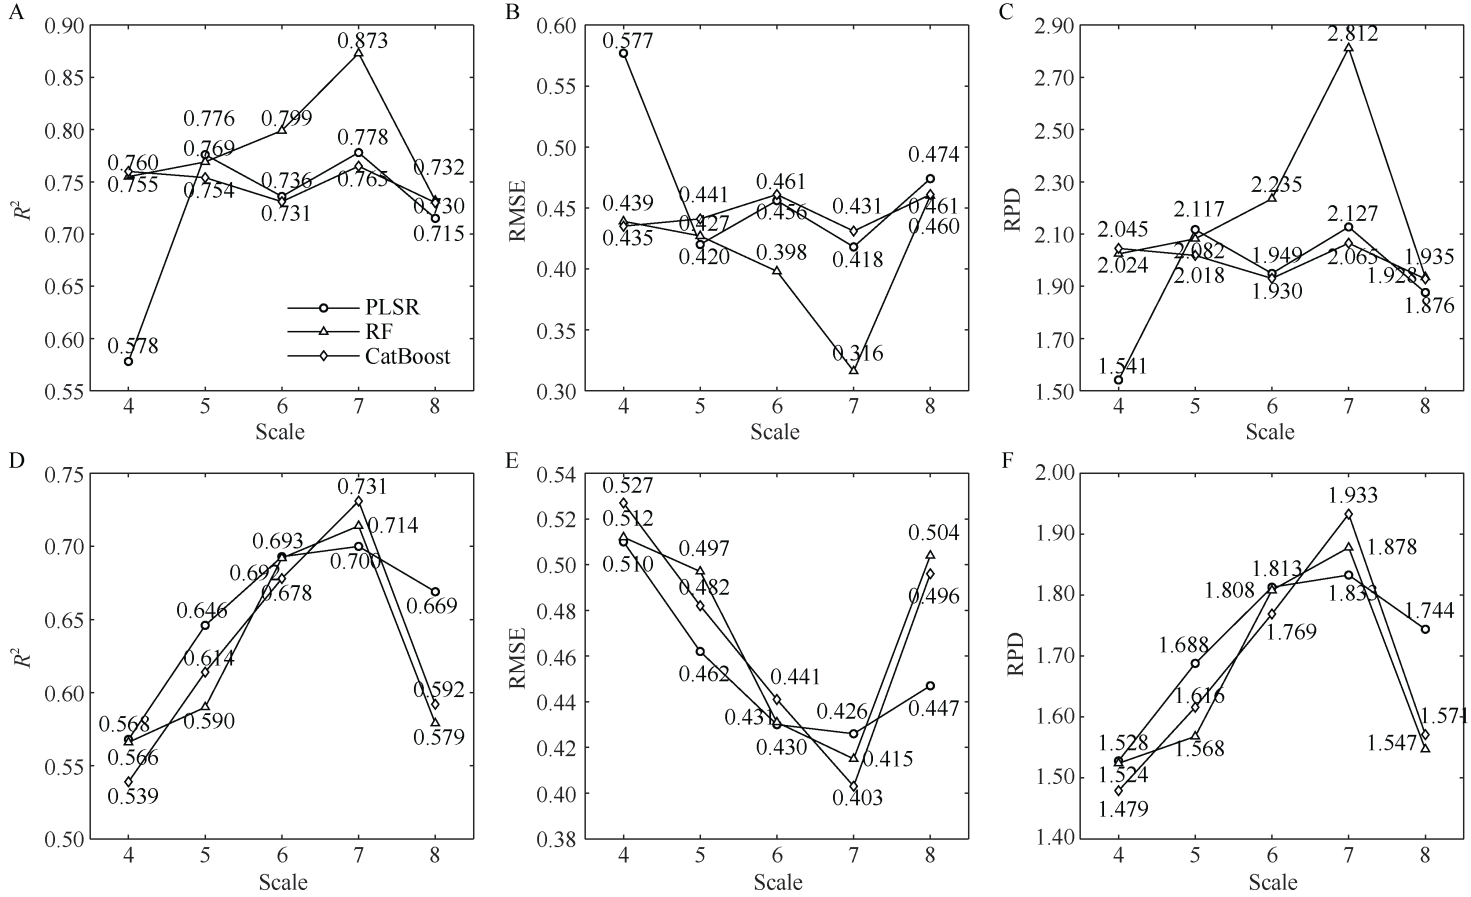
Accuracy of winter wheat LNC estimation models integrating different CWT scales and SPA A-C show the variation curves of R2, RMSE, and RPD for the calibration set, and D-F show those for the validation set. Abbreviations are the same as those given in Table 3 and Table 4."

Fig. 5

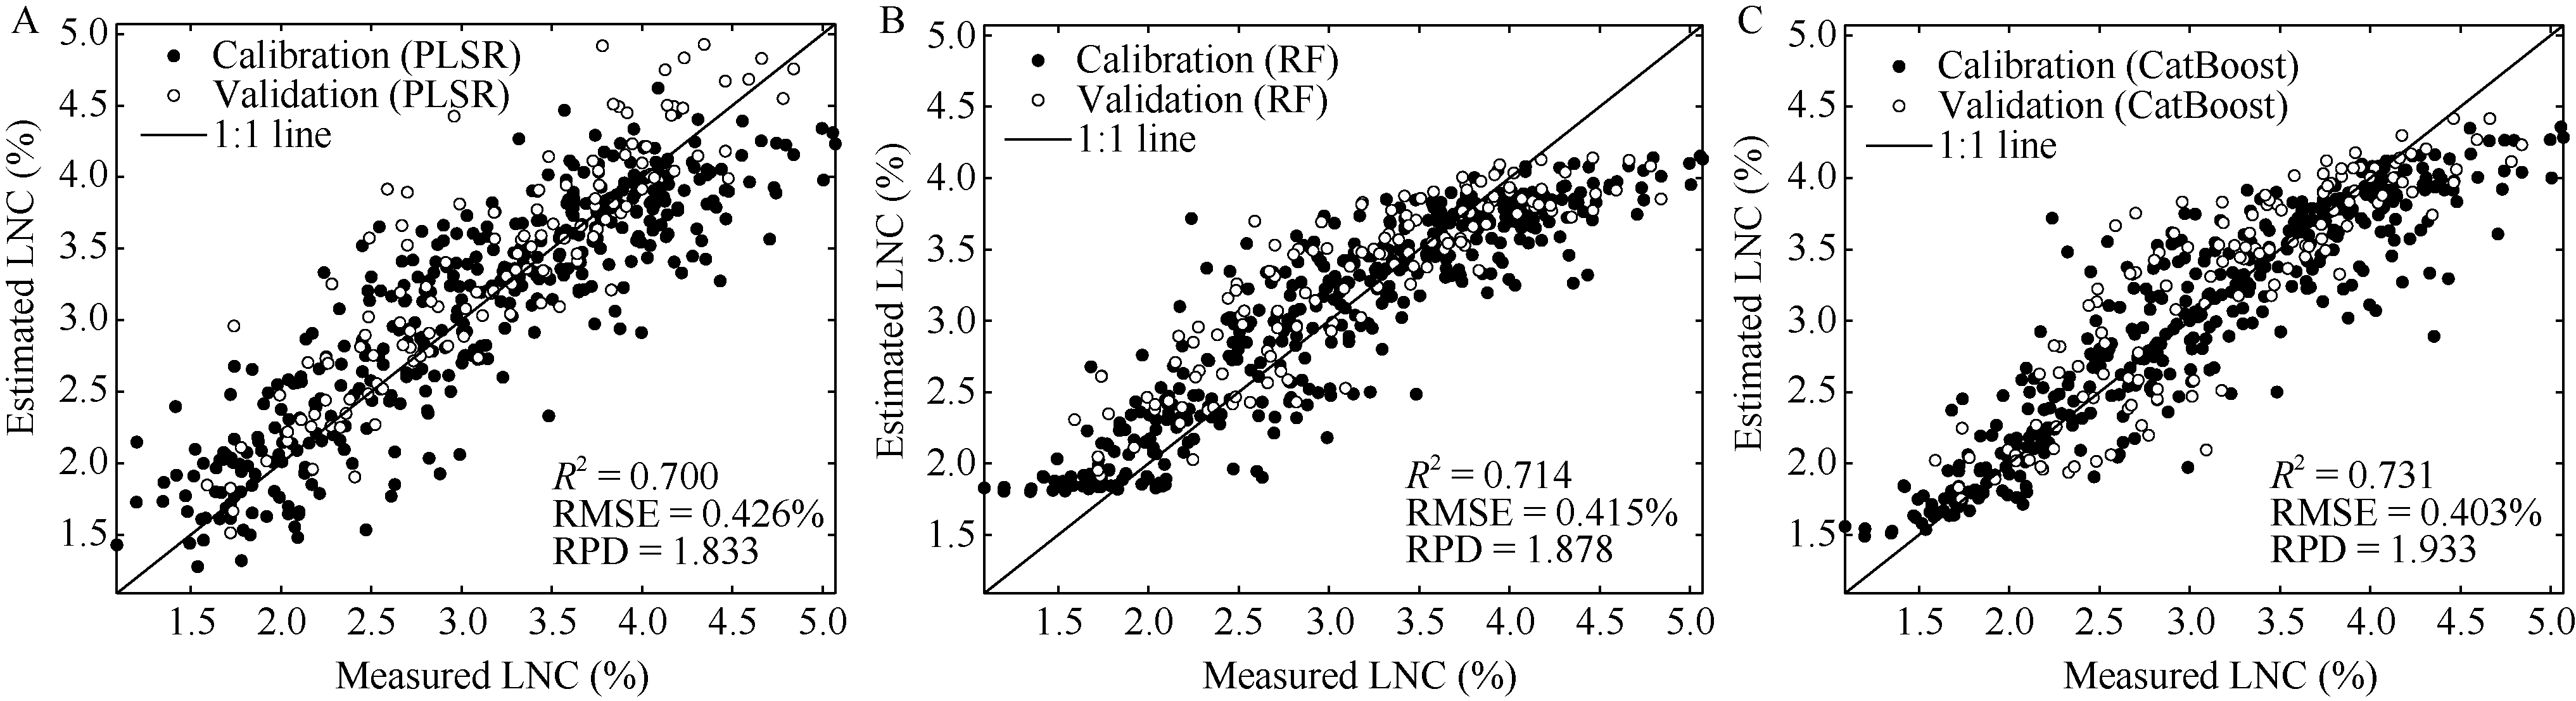
Performance of winter wheat LNC estimation models based on three machine learning methods using optimal-scale CWT and SPA Abbreviations are the same as those given in Table 3 and Table 4."

Fig. 6

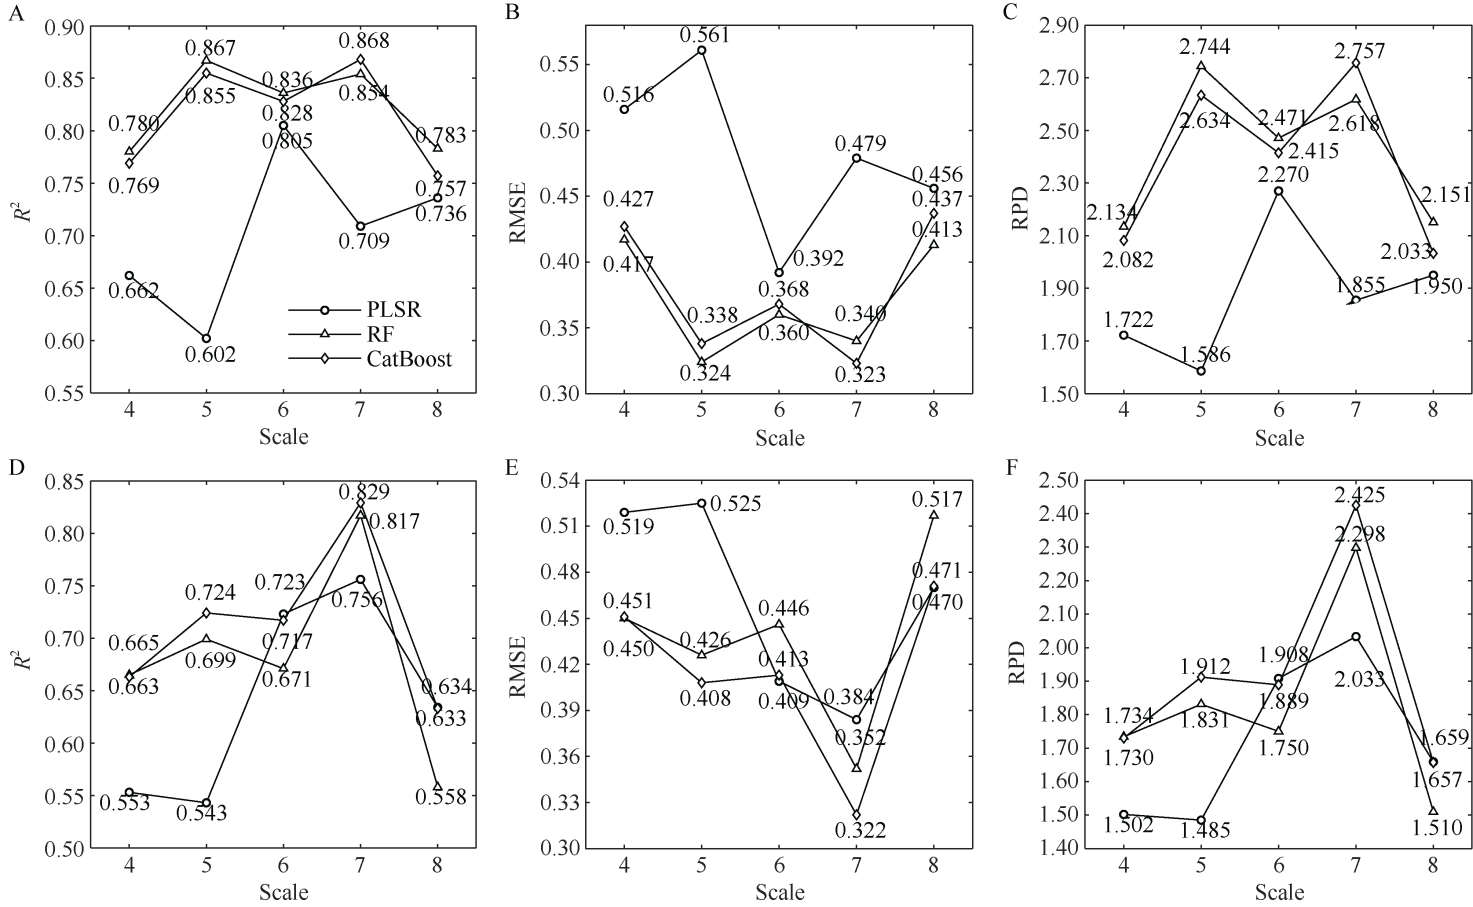
Accuracy of winter wheat LNC estimation models integrating different CWT scales and KSPA A-C show the variation curves of R2, RMSE, and RPD for the calibration set, and D-F show those for the validation set. Abbreviations are the same as those given in Table 3 and Table 4."

Fig. 7

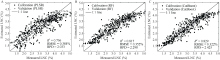
Performance of winter wheat LNC estimation models with three machine learning methods using optimal-scale CWT and KSPA Abbreviations are the same as those given in Table 3 and Table 4."

Table 5

Results of the CWT and KSPA ablation experiments"

特征
Feature
最佳尺度
Optimal scale
最佳模型
Optimal model
建模集Calibration set 验证集Validation set
R2 RMSE (%) RPD R2 RMSE (%) RPD
CWT 5 CatBoost 0.817 0.380 2.341 0.740 0.396 1.968
KSPA CatBoost 0.758 0.437 2.036 0.655 0.456 1.710

Fig. 8

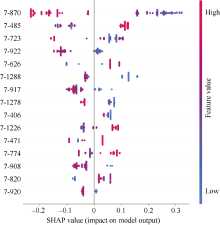
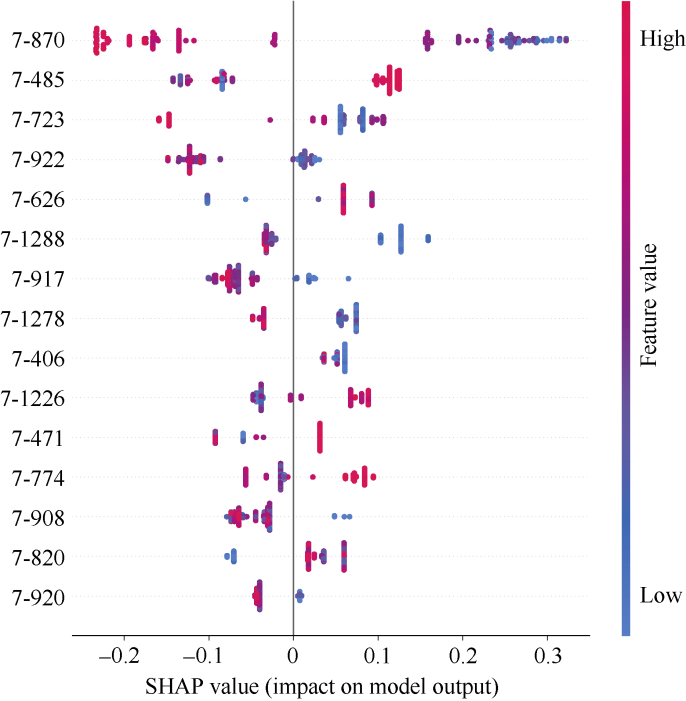
SHAP summary plot for the CatBoost model based on CWT scale 7 and KSPA feature selection Abbreviations are the same as those given in Table 3 and Table 4. SHAP: shapley additive explanations."

Table 6

Descriptive statistics of winter wheat LNC in each year"

指标
Index
试验1
Trial 1
试验2
Trial 2
试验3
Trial 3
试验4
Trial 4
样本数Sample 128 128 125 152
最大值Maximum value (%) 4.48 5.07 4.84 4.46
最小值Minimum value (%) 1.66 1.20 1.59 1.09
平均值Mean (%) 3.30 3.40 3.18 2.64
标准差Standard deviation (%) 0.71 0.98 0.78 0.75
变异系数Coefficient of variation (%) 21.52 28.82 24.53 28.41
峰值Kurtosis (%) 2.11 2.37 2.14 2.13

Table 7

Optimal performance of winter wheat LNC models in leave-one-year-out cross-validation using trials 2, 3, and 4 as the calibration set and trial 1 as the validation set"

特征
Feature
最佳尺度
Optimal scale
最佳模型
Optimal model
建模集Calibration set 验证集Validation set
R2 RMSE (%) RPD R2 RMSE (%) RPD
原始光谱Original spectrum PLSR 0.641 0.538 1.672 0.457 0.523 1.363
KSPA CatBoost 0.685 0.504 1.784 0.511 0.497 1.435
CWT 7 CatBoost 0.669 0.517 1.742 0.560 0.471 1.514
CWT+PLS-VIP 5 RF 0.742 0.456 1.971 0.602 0.448 1.591
CWT+SPA 6 CatBoost 0.752 0.448 2.009 0.624 0.467 1.527
CWT+KSPA 6 CatBoost 0.758 0.442 2.036 0.675 0.405 1.761

Table 8

Optimal performance of winter wheat LNC models in leave-one-year-out cross-validation using trials 1, 3, and 4 as the calibration set and trial 2 as the validation set"

特征
Feature
最佳尺度
Optimal scale
最佳模型
Optimal model
建模集Calibration set 验证集Validation set
R2 RMSE (%) RPD R2 RMSE (%) RPD
原始光谱Original spectrum PLSR 0.577 0.522 1.540 0.467 0.714 1.375
KSPA PLSR 0.693 0.445 1.807 0.529 0.671 1.464
CWT 7 CatBoost 0.776 0.380 2.114 0.544 0.660 1.487
CWT+PLS-VIP 7 CatBoost 0.675 0.458 1.756 0.523 0.675 1.454
CWT+SPA 7 CatBoost 0.750 0.402 2.001 0.582 0.632 1.553
CWT+KSPA 7 CatBoost 0.785 0.372 2.162 0.611 0.610 1.609

Table 9

Optimal performance of winter wheat LNC models in leave-one-year-out cross-validation using trials 1, 2, and 3 as the calibration set and trial 4 as the validation set"

特征
Feature
最佳尺度
Optimal scale
最佳模型
Optimal model
建模集Calibration set 验证集Validation set
R2 RMSE (%) RPD R2 RMSE (%) RPD
原始光谱Original spectrum CatBoost 0.699 0.458 1.826 0.437 0.562 1.338
KSPA RF 0.680 0.472 1.770 0.466 0.548 1.373
CWT 7 CatBoost 0.687 0.467 1.789 0.471 0.546 1.379
CWT+PLS-VIP 7 CatBoost 0.672 0.478 1.749 0.483 0.539 1.396
CWT+SPA 8 RF 0.661 0.486 1.719 0.478 0.542 1.389
CWT+KSPA 7 CatBoost 0.701 0.456 1.833 0.521 0.502 1.498
[1] Fu Y Y, Yang G J, Pu R L, et al. An overview of crop nitrogen status assessment using hyperspectral remote sensing: current status and perspectives. Eur J Agron, 2021, 124: 126241.
doi: 10.1016/j.eja.2021.126241
[2] Zhao J, Li H, Liu J P, et al. Integration of spatial attention mechanism into 1D-CNN for prediction of wheat leaf nitrogen concentration from UAV-borne hyperspectral imagery. Comput Electron Agric, 2025, 239: 110906.
doi: 10.1016/j.compag.2025.110906
[3] Fu Y Y, Yang G J, Li Z H, et al. Progress of hyperspectral data processing and modelling for cereal crop nitrogen monitoring. Comput Electron Agric, 2020, 172: 105321.
doi: 10.1016/j.compag.2020.105321
[4] 梁进宇, 尹嘉德, 王红丽, 等. 基于无人机高光谱和机器学习的旱地饲用玉米叶片氮含量估测. 作物学报, 2026, 52: 1788-1801.
doi: 10.3724/SP.J.1006.2026.53085
Liang J Y, Yin J D, Wang H L, et al. Estimation of leaf nitrogen content in dryland forage maize using UAV-based hyperspectral imaging and machine learning. Acta Agron Sin, 2026, 52: 1788-1801 (in Chinese with English abstract).
doi: 10.3724/SP.J.1006.2026.53085
[5] 李艳大, 曹中盛, 潘玉霞, 等. 基于便携式蜜柚光谱仪的金沙柚叶片氮含量监测模型研究. 果树学报, 2023, 40: 797-806.
Li Y D, Cao Z S, Pan Y X, et al. A model for monitoring leaf nitrogen content of Jinsha pomelo based on portable pomelo spectrometer. J Fruit Sci, 2023, 40: 797-806 (in Chinese with English abstract).
[6] 金庆宇, 孟庆伟, 闫东, 等. 光谱指数优化提高玉米叶片氮浓度估测精度. 玉米科学, 2025, 33(4): 65-74.
Jin Q Y, Meng Q W, Yan D, et al. Optimization of spectral indices for improved accuracy in estimating nitrogen concentration in maize leaves. J Maize Sci, 2025, 33(4): 65-74 (in Chinese with English abstract).
[7] 郭新惠, 乔星星, 赵钰, 等. 不同施氮水平下冬小麦叶片氮含量的高光谱遥感监测. 山西农业科学, 2025, 53(5): 92-100.
Guo X H, Qiao X X, Zhao Y, et al. Hyperspectral remote sensing monitoring of leaf nitrogen content in winter wheat under different nitrogen application levels. J Shanxi Agric Sci, 2025, 53(5): 92-100 (in Chinese with English abstract).
[8] 杨锡震, 陈俊英, 张秋雨, 等. 基于小波特征和冬小麦生理参数的土壤水分高光谱模型优化. 农业工程学报, 2023, 39(10): 66-75.
Yang X Z, Chen J Y, Zhang Q Y, et al. Optimization of the soil moisture model based on hyperspectral inversion by integrating wavelet features and growth parameters of winter wheat. Trans CSAE, 2023, 39(10): 66-75 (in Chinese with English abstract).
[9] 樊杰杰, 邱春霞, 樊意广, 等. 基于连续小波变换和机器学习的小麦产量预测. 光谱学与光谱分析, 2024, 44: 2890-2899.
Fan J J, Qiu C X, Fan Y G, et al. Wheat yield prediction based on continuous wavelet transform and machine learning. Spectrosc Spectr Anal, 2024, 44: 2890-2899 (in Chinese with English abstract).
[10] Zhao X H, Zhang J C, Pu R L, et al. The continuous wavelet projections algorithm: a practical spectral-feature-mining approach for crop detection. Crop J, 2022, 10: 1264-1273.
doi: 10.1016/j.cj.2022.04.018
[11] Chen X K, Li F L, Chang Q R. Combination of continuous wavelet transform and successive projection algorithm for the estimation of winter wheat plant nitrogen concentration. Remote Sens, 2023, 15: 997.
doi: 10.3390/rs15040997
[12] Li L T, Geng S N, Lin D, et al. Accurate modeling of vertical leaf nitrogen distribution in summer maize using in situ leaf spectroscopy via CWT and PLS-based approaches. Eur J Agron, 2022, 140: 126607.
doi: 10.1016/j.eja.2022.126607
[13] Wang Z L, Chen J X, Zhang J W, et al. Assessing canopy nitrogen and carbon content in maize by canopy spectral reflectance and uninformative variable elimination. Crop J, 2022, 10: 1224-1238.
doi: 10.1016/j.cj.2021.12.005
[14] Wang J J, Bensmail H, Gao X. Feature selection and multi-kernel learning for sparse representation on a manifold. Neural Netw, 2014, 51: 9-16.
doi: 10.1016/j.neunet.2013.11.009
[15] Yamada M, Jitkrittum W, Sigal L, et al. High-dimensional feature selection by feature-wise kernelized Lasso. Neural Comput, 2014, 26: 185-207.
doi: 10.1162/NECO_a_00537 pmid: 24102126
[16] Wang K Z, Xiao H T. Sparse kernel feature extraction via support vector learning. Pattern Recognit Lett, 2018, 101: 67-73.
[17] Tian Y C, Yao X, Yang J, et al. Assessing newly developed and published vegetation indices for estimating rice leaf nitrogen concentration with ground- and space-based hyperspectral reflectance. Field Crops Res, 2011, 120: 299-310.
doi: 10.1016/j.fcr.2010.11.002
[18] He L, Song X, Feng W, et al. Improved remote sensing of leaf nitrogen concentration in winter wheat using multi-angular hyperspectral data. Remote Sens Environ, 2016, 174: 122-133.
doi: 10.1016/j.rse.2015.12.007
[19] Li L, Liu S S, Wang S Q, et al. Assessing plant nitrogen concentration in winter oilseed rape using hyperspectral measurements. J Appl Remote Sens, 2016, 10: 036026.
doi: 10.1117/1.JRS.10.036026
[20] Feng W, Yao X, Zhu Y, et al. Monitoring leaf nitrogen status with hyperspectral reflectance in wheat. Eur J Agron, 2008, 28: 394-404.
doi: 10.1016/j.eja.2007.11.005
[21] Ranjan R, Chopra U K, Sahoo R N, et al. Assessment of plant nitrogen stress in wheat (Triticum aestivum L.) through hyperspectral indices. Int J Remote Sens, 2012, 33: 6342-6360.
doi: 10.1080/01431161.2012.687473
[22] Zhou X F, Huang W J, Kong W P, et al. Remote estimation of canopy nitrogen content in winter wheat using airborne hyperspectral reflectance measurements. Adv Space Res, 2016, 58: 1627-1637.
doi: 10.1016/j.asr.2016.06.034
[23] Feng W, Guo B B, Zhang H Y, et al. Remote estimation of above ground nitrogen uptake during vegetative growth in winter wheat using hyperspectral red-edge ratio data. Field Crops Res, 2015, 180: 197-206.
doi: 10.1016/j.fcr.2015.05.020
[24] Yu K, Li F, Gnyp M L, et al. Remotely detecting canopy nitrogen concentration and uptake of paddy rice in the Northeast China Plain. ISPRS J Photogramm Remote Sens, 2013, 78: 102-115.
doi: 10.1016/j.isprsjprs.2013.01.008
[25] Cheng X Z, Feng Y Y, Guo A T, et al. Detection of rubber tree powdery mildew from leaf level hyperspectral data using continuous wavelet transform and machine learning. Remote Sens, 2024, 16: 105.
doi: 10.3390/rs16010105
[26] Li F L, Wang L, Liu J, et al. Evaluation of leaf N concentration in winter wheat based on discrete wavelet transform analysis. Remote Sens, 2019, 11: 1331.
doi: 10.3390/rs11111331
[27] Breiman L. Random forests. Mach Learn, 2001, 45: 5-32.
doi: 10.1023/A:1010933404324
[28] Hancock J T, Khoshgoftaar T M. CatBoost for big data: an interdisciplinary review. J Big Data, 2020, 7: 94.
doi: 10.1186/s40537-020-00369-8 pmid: 33169094
[29] 林娜, 全海琳, 李双桃, 等. 基于SHAP可解释特征优选的撂荒耕地遥感提取. 农业工程学报, 2025, 41(14): 291-302.
Lin N, Quan H L, Li S T, et al. Extracting abandoned farmland from remote sensing images using SHAP-interpretable feature optimization. Trans CSAE, 2025, 41(14): 291-302 (in Chinese with English abstract).
[30] Chang C W, Laird D A. Near-infrared reflectance spectroscopic analysis of soil C and N. Soil Sci, 2002, 167: 110-116.
doi: 10.1097/00010694-200202000-00003
[31] Liu N, Xing Z Z, Zhao R M, et al. Analysis of chlorophyll concentration in potato crop by coupling continuous wavelet transform and spectral variable optimization. Remote Sens, 2020, 12: 2826.
doi: 10.3390/rs12172826
No related articles found!
Viewed
Full text


Abstract

Cited

  Shared   
  Discussed   
No Suggested Reading articles found!