欢迎访问作物学报,今天是
作物学报 ›› 2020, Vol. 46 ›› Issue (5): 787-797.doi: 10.3724/SP.J.1006.2020.91049
吾木提·艾山江1,2,4,买买提·沙吾提1,2,3,*( ),陈水森4,李丹4
HASAN Umut1,2,4,SAWUT Mamat1,2,3,*(),Shui-Sen CHEN4,Dan LI4
摘要:
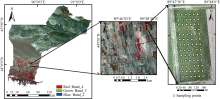
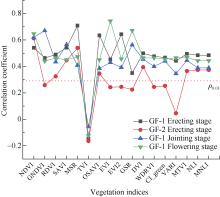
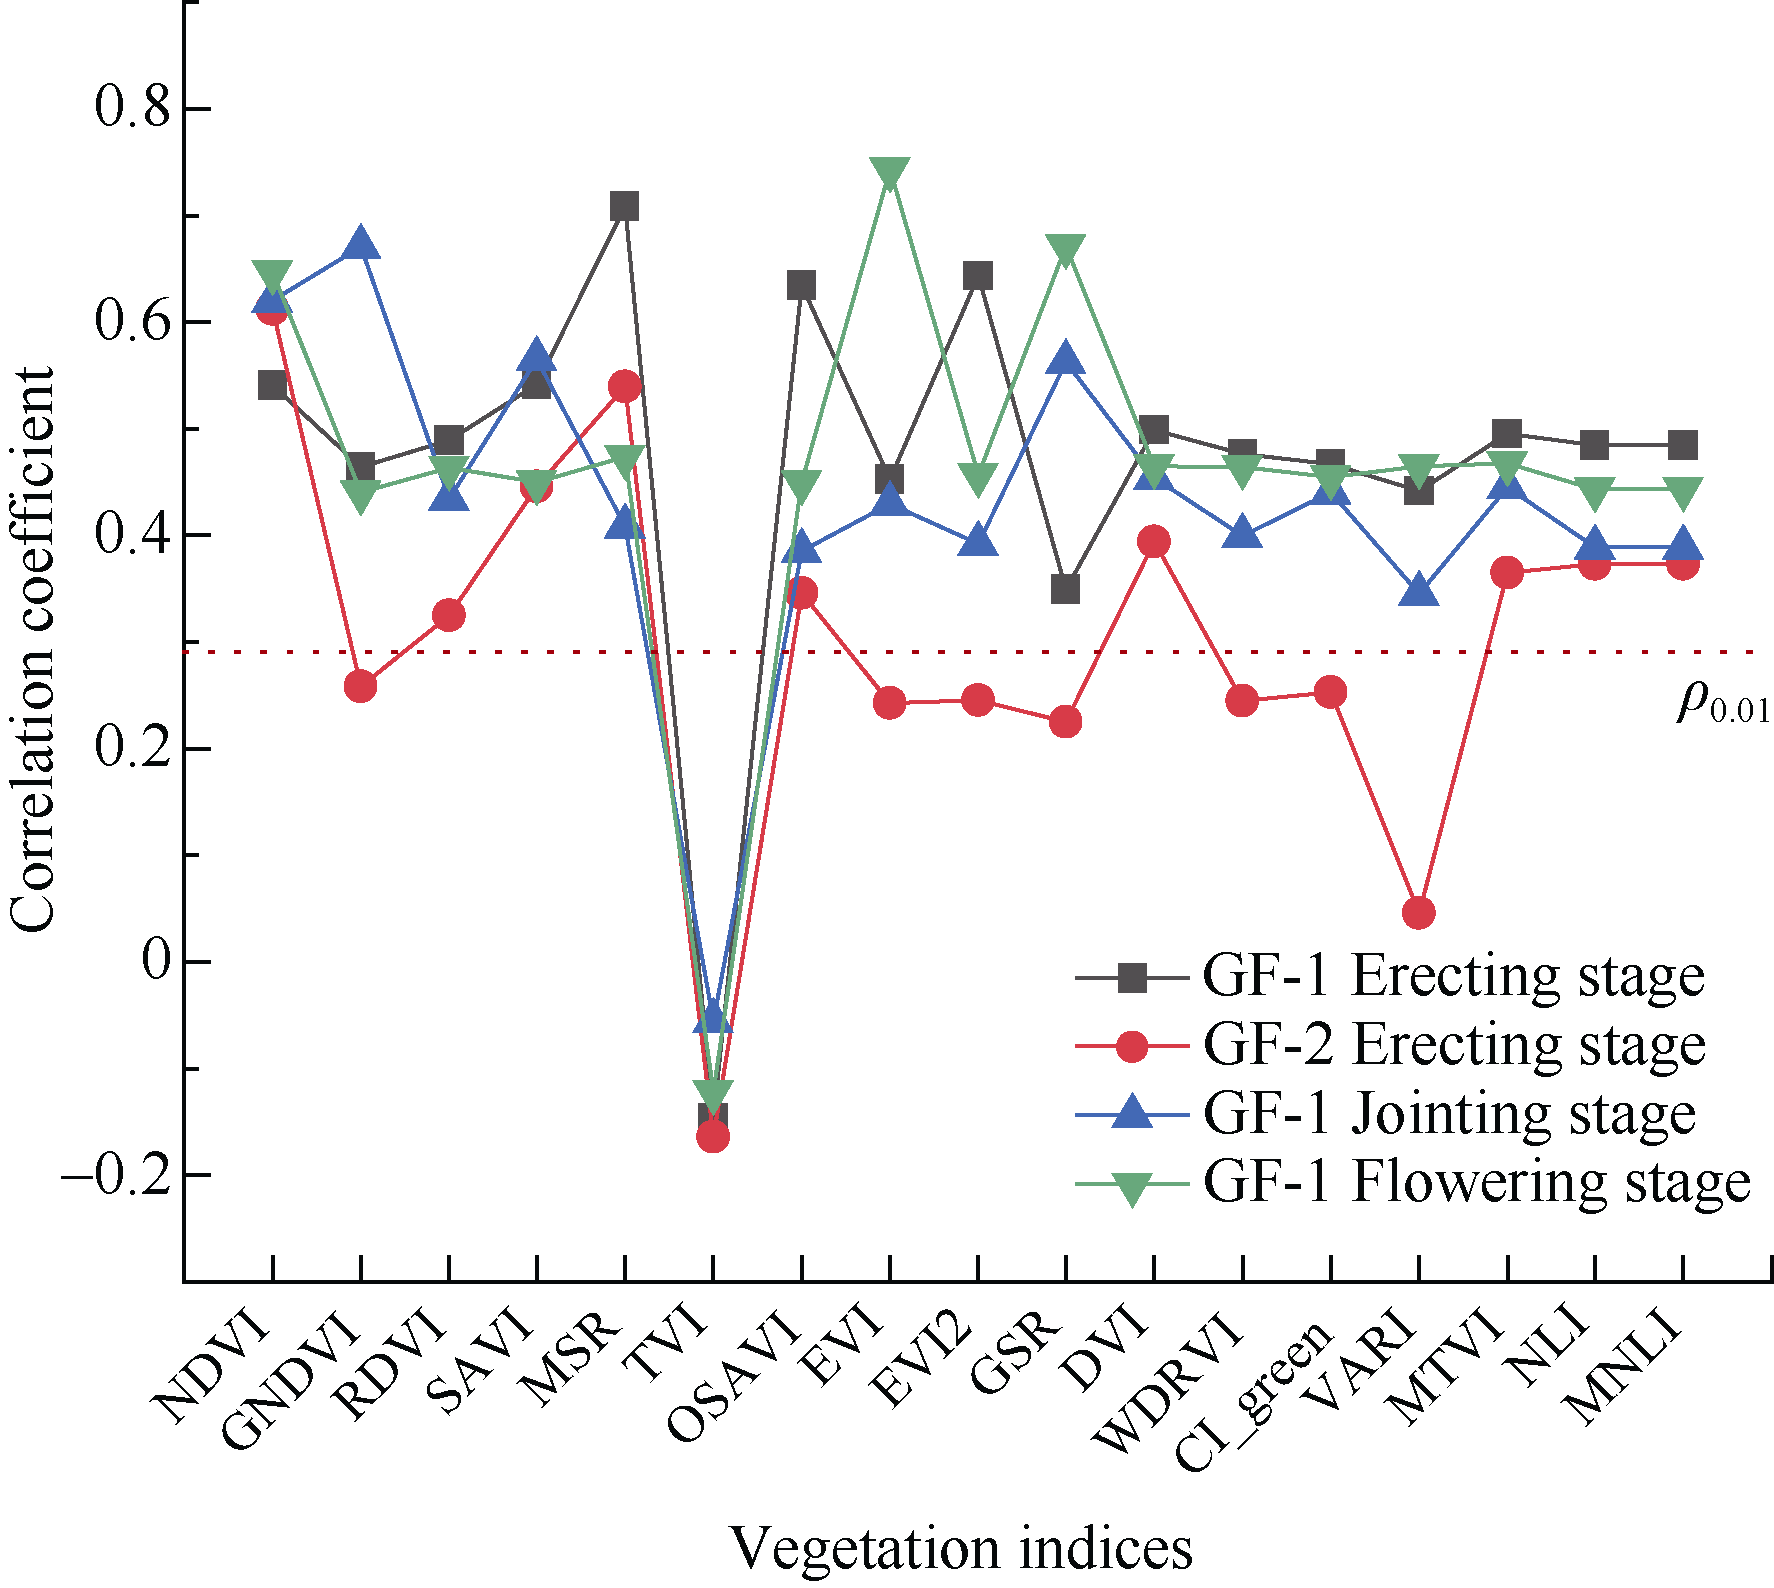
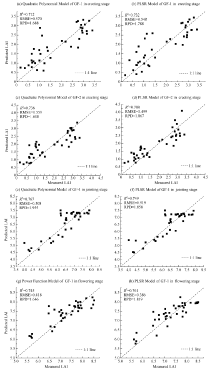
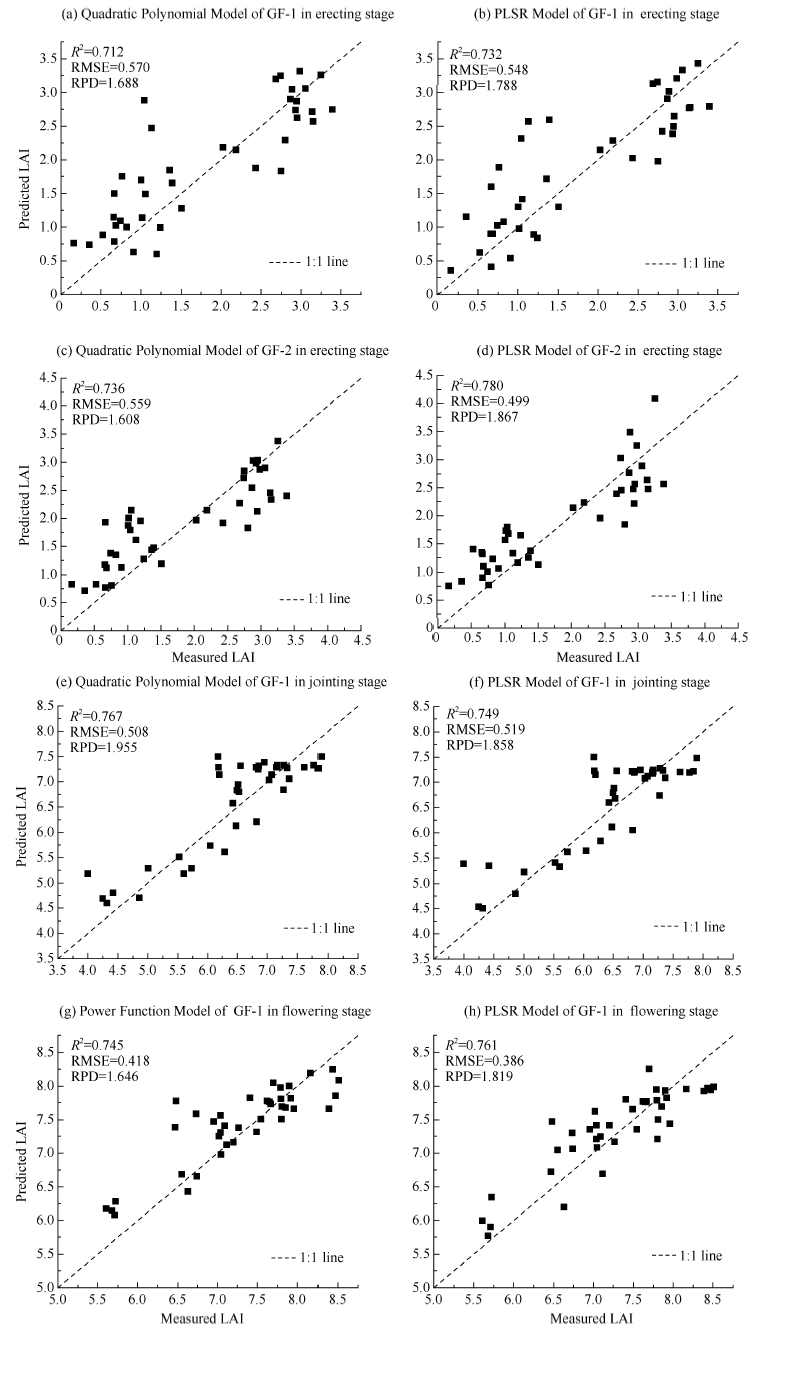
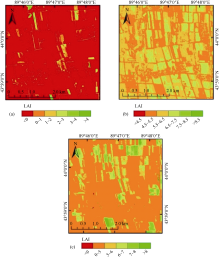
叶面积指数(leaf area index, LAI)是监测作物生长状况的重要参数, 准确、快速、大面积估算LAI不仅有助于更好地监测农作物, 而且也有助于其在建模、总体作物管理及精准农业中的应用。本研究为了利用国产遥感影像快速、大面积反演冬小麦LAI, 以GF-1/2影像作为数据源, 提取常用植被指数, 结合不同生育期(起身期、拔节期、开花期)实测LAI数据, 建立反演冬小麦LAI的单变量和多变量经验模型, 并对其进行验证。结果表明, GF-1起身期、GF-1拔节期以及GF-1开花期提取的植被指数中, MSR (modified simple ratio)、GNDVI (green normalized difference vegetation index)、EVI (enhanced vegetation index)与LAI间的相关系数最大, 分别为0.708、0.671和0.743, 说明这些植被指数与冬小麦LAI间的相关性较显著; GF-1不同生育期的反演模型相比, 基于拔节期GNDVIGF-1建立的二次多项式模型和基于开花期EVIGF-1、GSRGF-1 (green simple ratio)、NDVIGF-1 (normalized difference vegetation index)建立的PLSR (partial least squares regression)模型R 2最大, 均为0.783, PLSR模型的RMSE小于二次多项式模型, 说明该多变量模型的稳定性优于单变量模型; 同一个生育期不同影像相比, 基于GF-2的NDVIGF-2建立的二次多项式模型和基于NDVIGF-2、MSRGF-2、SAVIGF-2 (soil-adjusted vegetation index)建立的PLSR模型精度高于基于GF-1的2种模型, R 2分别为0.768和0.809; 不同生育期反演的LAI分布图表明, LAI反演值与实测LAI值基本吻合。以上研究结果说明国产高分辨率遥感影像在农作物生理参数反演中有一定的应用价值, 可以为以后的相关研究提供一定的参考。
| [1] | Chen J M, Black T A . Defining leaf area index for non-flat leaves. Plant Cell & Environ, 2010,15:421-429. |
| [2] | 张显峰, 廖春华 . 生态环境参数遥感协同反演与同化模拟. 北京: 科学出版社, 2014. pp 22-23. |
| Zhang X F, Liao C H. Synergistic Inversion and Assimilation Simulation of Ecological Environment Parameters by Remote sensing. Beijing: Science Press, 2014. pp 22-23(in Chinese). | |
| [3] |
Barclay H J . Conversion of total leaf area to projected leaf area in lodgepole pine and Douglas-fir. Tree Physiol, 1998,18:185-193.
doi: 10.1093/treephys/18.3.185 pmid: 12651388 |
| [4] | 孙涛 . 农作物叶面积指数反演方法研究——以水稻和小麦为例. 南京信息工程大学硕士学位论文, 江苏南京, 2013. |
| Sun T . Study on Inversion Method of Crop Leaf Area Index: A Case Study of Rice and Wheat. MS Thesis of Nanjing University of Information Science & Technology, Nanjing, China, 2013 (in Chinese with English abstract). | |
| [5] |
Pinty B, Lavergne T, Widlowski J L, Gobrona N, Verstraetea M M . On the need to observe vegetation canopies in the near-infrared to estimate visible light absorption. Remote Sense Environ, 2009,113:10-23.
doi: 10.1016/j.rse.2008.08.017 |
| [6] |
李鑫川, 徐新刚, 鲍艳松, 黄文江, 罗菊花, 董莹莹, 宋晓宇, 王纪华 . 基于分段方式选择敏感植被指数的冬小麦叶面积指数遥感反演. 中国农业科学, 2012,45:3486-3496.
doi: 10.3864/j.issn.0578-1752.2012.17.004 |
|
Li X C, Xu X G, Bao Y S, Huang W J, Luo J H, Dong Y Y, Song X Y, Wang J H . Retrieving LAI of winter wheat based on sensitive vegetation index by the segmentation method. Sci Agric Sin, 2012,45:3486-3496 (in Chinese with English abstract).
doi: 10.3864/j.issn.0578-1752.2012.17.004 |
|
| [7] | 陈艳华, 张万昌, 雍斌 . 基于分类知识利用神经网络反演叶面积指数. 生态学报, 2007,27:2785-2793. |
| Chen Y H, Zhang W C, Yong B . Retrieving leaf area index using a neural network based on classification knowledge. Acta Ecol Sin, 2007,27:2785-2793 (in Chinese with English abstract). | |
| [8] | 刘明, 冯锐, 纪瑞鹏, 武晋雯, 王宏博, 于文颖 . 基于MODIS-NDVI的春玉米叶面积指数和地上生物量估算. 中国农学通报, 2014,31(6):80-87. |
| Liu M, Feng R, Ji R P, Wu J W, Wang H B, Yu W Y . Estimation of leaf area index and aboveground biomass of spring maize by MODIS-NDVI. Chin Agric Sci Bull, 2014,31(6):80-87 (in Chinese with English abstract). | |
| [9] |
Masayasu M, Koki H . Empirical regression models for estimating multiyear leaf area index of rice from several vegetation indices at the field scale. Remote Sens, 2014,6:4764-4779.
doi: 10.3390/rs6064764 |
| [10] |
Mairaj D, Wen Z, Muhammad R, Wang S Q, Shi Z H . Evaluating hyperspectral vegetation indices for leaf area index estimation of Oryza sativa L. at diverse phenological stages. Front Plant Sci, 2017,8:820-837.
doi: 10.3389/fpls.2017.00820 pmid: 28588596 |
| [11] | 苏伟, 侯宁, 李琪, 张明政, 赵晓凤, 蒋坤萍 . 基于Sentinel-2遥感影像的玉米冠层叶面积指数反演. 农业机械学报, 2018,49(1):151-156. |
| Su W, Hou N, Li Q, Zhang M Z, Zhao X F, Jiang K P . Retrieving leaf area index of corn canopy based on sentinel-2 remote sensing image. Trans CSAM, 2018,49(1):151-156 (in Chinese with English abstract). | |
| [12] |
Propastin P A . Spatial non-stationarity and scale-dependency of prediction accuracy in the remote estimation of LAI over a tropical rainforest in Sulawesi, Indonesia. Remote Sense Environ, 2009,113:2234-2242.
doi: 10.1016/j.rse.2009.06.007 |
| [13] | 高林, 杨贵军, 于海洋, 徐波, 赵晓庆, 董锦绘, 马亚斌 . 基于无人机高光谱遥感的冬小麦叶面积指数反演. 农业工程学报, 2016,32(22):113-120. |
| Gao L, Yang G J, Yu H Y, Xu B, Zhao X Q, Dong J H, Ma Y B . Retrieving winter wheat leaf area index based on unmanned aerial vehicle hyperspectral remoter sensing. Trans CSAE, 2016,32(22):113-120 (in Chinese with English abstract). | |
| [14] |
杜鹤娟, 柳钦火, 李静, 杨乐 . 光学与微波植被指数协同反演农作物叶面积指数的可行性分析. 遥感学报, 2013,17:1587-1611.
doi: 10.11834/jrs.20133035 |
|
Du H J, Liu Q H, Li J, Yang L . Retrieving crop leaf area index by combining optical and microwave vegetation indices: a feasibility analysis. J Remote Sens, 2013,17:1587-1611 (in Chinese with English abstract).
doi: 10.11834/jrs.20133035 |
|
| [15] | Liang L, Di L P, Zhang L P, Deng M X, Qin Z H, Zhao S H, Lin H . Estimation of crop LAI using hyperspectral vegetation indices and a hybrid inversion method. Remote Sense Environ, 2015,165:123-134. |
| [16] | 李亚妮, 鲁蕾, 刘勇 . 基于PROSAIL模型的水稻田缨帽三角-叶面积指数模型及其应用. 应用生态学报, 2017,28:3976-3984. |
| Li Y N, Lu L, Liu Y . Tasseled cap triangle (TCT)-leaf area index (LAI) model of rice fields based on PROSAIL model and its application. Chin J Appl Ecol, 2017,28:3976-3984 (in Chinese with English abstract). | |
| [17] | 魏海鹏, 贾永红, 孔建平, 曾雪华, 邢玉萍 . 适宜新疆奇台生态区种植的春小麦品种探究. 农业科技通讯, 2017, ( 5):88-90. |
| Wei H P, Jia Y H, Kong J P, Zeng X H, Xing Y P . Study on spring wheat varieties suitable for planting in Qitai eco-region of Xinjiang. Bull Agric Sci Technol, 2017, ( 5):88-90 (in Chinese with English abstract). | |
| [18] | Schell J A . Monitoring vegetation systems in the great plains with ERTS. NASA Special Public, 1973,351:309. |
| [19] |
Gitelson A A, Merzlyak M N . Remote sensing of chlorophyll concentration in higher plant leaves. Adv Space Res, 1998,22:689-692.
doi: 10.1016/S0273-1177(97)01133-2 |
| [20] |
Haboudane D, Miller J R, Pattey E, Zarco-Tejadad P J, Strachane I B . Hyperspectral vegetation indices and novel algorithms for predicting green LAI of crop canopies: modeling and validation in the context of precision agriculture. Remote Sense Environ, 2004,90:337-352.
doi: 10.1016/j.rse.2003.12.013 |
| [21] | 黄文江, 孔维平, 谢巧云 . 作物理化参数遥感定量反演. 北京: 科学出版社, 2017. pp 51-76. |
| Huang W J, Kong W P, Xie Q Y. Quantitative Retrieval of Crop Physical and Chemical Parameters by Remote Sensing. Beijing: Science Press, 2017. pp 51-76(in Chinese). | |
| [22] | Sims D A, Gamon J A . Relationships between leaf pigment content and spectral reflectance across a wide range of species, leaf structures and developmental stages. Remote Sense Environ, 2002,81:337-354. |
| [23] | Huete A R . A soil-adjusted vegetation index (SAVI). Remote Sense Environ, 1988,25:295-309. |
| [24] |
Huete A, Didan K, Miura T, Rodrigueza E P, Gao X, Ferreirab L G . Overview of the radiometric and biophysical performance of the MODIS vegetation indices. Remote Sense Environ, 2002,83:195-213.
doi: 10.1016/S0034-4257(02)00096-2 |
| [25] |
Jiang Z, Huete A R, Didan K, Miurab T . Development of a two-band enhanced vegetation index without a blue band. Remote Sense Environ, 2008,112:3833-3845.
doi: 10.1016/j.rse.2008.06.006 |
| [26] |
Sripada R P, Heiniger R W, White J G, Meijer A D . Aerial color infrared photography for determining in-season nitrogen requirements for corn. Agron J, 2006,98:968-977.
doi: 10.2134/agronj2005.0200 |
| [27] | Tucker C J . Red and photographic infrared linear combinations for monitoring vegetation. Remote Sense Environ, 1979,8:127-150. |
| [28] |
Gitelson A A . Wide dynamic range vegetation index for remote quantification of biophysical characteristics of vegetation. J Plant Physiol, 2004,161:165-173.
doi: 10.1078/0176-1617-01176 pmid: 15022830 |
| [29] |
Gitelson A A, Gritz Y, Merzlyak M N . Relationships between leaf chlorophyll content and spectral reflectance and algorithms for non-destructive chlorophyll assessment in higher plant leaves. J Plant Physiol, 2003,160:271-282.
doi: 10.1078/0176-1617-00887 pmid: 12749084 |
| [30] | Gitelson A A, Stark R, Grits U, Rundquist D, Kaufman Y, Derry D . Vegetation and soil lines in visible spectral space: A concept and technique for remote estimation of vegetation fraction. Internat J Remote Sens, 2002,23:2537-2562. |
| [31] | Gong P, Pu R, Biging G S, Larrieu M R . Estimation of forest leaf area index using vegetation indices derived from hyperion hyperspectral data. IEEE Transact Geosci Remote Sens, 2003,41:1355-1362. |
| [32] |
Xia X, Sun Y, Wu K, Jiang Q . Optimization of a straw ring-die briquetting process combined analytic hierarchy process and grey correlation analysis method. Fuel Proc Technol, 2016,152:303-309.
doi: 10.1016/j.fuproc.2016.06.018 |
| [33] | Fang S S, Yao X S, Zhang J Q, Han M . Grey Correlation Analysis on Travel Modes and their Influence Factors. Proc Engin, 2017,174:347-352. |
| [34] | Elarab M, Ticlavilca A M, Torres-Rua A F, Maslovac I, McKeeab M . Estimating chlorophyll with thermal and broadband multispectral high resolution imagery from an unmanned aerial system using relevance vector machines for precision agriculture. Int J Appl Earth Obs, 2015,140:32-42. |
| [35] |
Maitiniyazi M, Abduwasit G, Paheding S, Sean H, Matthew M, Kyle P, Ethan S, Jack F, Jim P, Suhas K, Joel B, Felix F . Unmanned Aerial System (UAS)-based phenotyping of soybean using multi-sensor data fusion and extreme learning machine. ISPRS J Photogr Remote Sens, 2017,134:43-58.
doi: 10.1016/j.isprsjprs.2017.10.011 |
| [36] | Ding S, Zhao H, Zhang Y, Xu X, Nie R . Extreme learning machine: algorithm, theory and applications. Artific Intellig Rev, 2015,44:103-115. |
| [37] |
Huang G B, Zhou H, Ding X, Zhang R . Extreme learning machine for regression and multiclass classification. IEEE Transact Syst Man Cybern Part B (Cybernetics), 2012,42:513-529.
doi: 10.1109/TSMCB.2011.2168604 pmid: 21984515 |
| [38] | 束美艳, 顾晓鹤, 孙林, 朱金山, 杨贵军, 王延仓, 张丽妍 . 基于新型植被指数的冬小麦LAI高光谱反演. 中国农业科学, 2018,51:3486-3496. |
| Shu M Y, Gu X H, Sun L, Zhu J S, Yang G J, Wang Y C, Zhang L Y . High spectral inversion of winter wheat LAI based on new vegetation index. Sci Agric Sin, 2018,51:3486-3496 (in Chinese with English abstract). | |
| [39] | 高林, 杨贵军, 李长春, 冯海宽, 徐波, 王磊, 董锦绘, 付奎 . 基于光谱特征与PLSR结合的叶面积指数拟合方法的无人机画幅高光谱遥感应用. 作物学报, 2017,43:549-557. |
| Gao L, Yang G J, Li C C, Feng H K, Xu B, Wang L, Dong J H, Fu K . Application of an improved method in retrieving leaf area index combined spectral index with PLSR in hyperspectral data generated by unmanned aerial vehicle snapshot camera. Acta Agron Sin, 2017,43:549-557 (in Chinese with English abstract). |
| [1] | 张矞勋, 齐拓野, 孙源, 璩向宁, 曹媛, 吴梦瑶, 刘春虹, 王磊. 高分六号遥感影像植被特征及其在冬小麦苗期LAI反演中的应用[J]. 作物学报, 2021, 47(12): 2532-2540. |
| [2] | 李艳大, 曹中盛, 舒时富, 孙滨峰, 叶春, 黄俊宝, 朱艳, 田永超. 基于作物生长监测诊断仪的双季稻叶干重监测模型[J]. 作物学报, 2021, 47(10): 2028-2035. |
| [3] | 于宁宁,张吉旺,任佰朝,赵斌,刘鹏. 综合农艺管理对夏玉米叶片生长发育及内源激素含量的影响[J]. 作物学报, 2020, 46(6): 960-967. |
| [4] | 李宗飞,苏继霞,费聪,李阳阳,刘宁宁,戴宇祥,张开祥,王开勇,樊华,陈兵. 基于高光谱数据的滴灌甜菜叶片全氮含量估算[J]. 作物学报, 2020, 46(4): 557-570. |
| [5] | 吴亚鹏,贺利,王洋洋,刘北城,王永华,郭天财,冯伟. 冬小麦生物量及氮积累量的植被指数动态模型研究[J]. 作物学报, 2019, 45(8): 1238-1249. |
| [6] | 王利民,杨玲波,刘佳,杨福刚,姚保民. GF-1和MODIS影像冬小麦长势监测指标NDVI的对比[J]. 作物学报, 2018, 44(7): 1043-1054. |
| [7] | 高林,杨贵军,李长春,冯海宽,徐波,王磊,董锦绘,付奎. 基于光谱特征与PLSR结合的叶面积指数拟合方法的无人机画幅高光谱遥感应用[J]. 作物学报, 2017, 43(04): 549-557. |
| [8] | 武文明,陈洪俭,王世济,魏凤珍,李金才. 氮肥运筹对苗期受渍夏玉米干物质和氮素积累与转运的影响[J]. 作物学报, 2015, 41(08): 1246-1256. |
| [9] | 齐波,张宁, 赵团结,邢光南,赵晋铭*,盖钧镒. 利用高光谱技术估测大豆育种材料的叶面积指数[J]. 作物学报, 2015, 41(07): 1073-1085. |
| [10] | 李龙,王兰芬,武晶,景蕊莲,王述民. 普通菜豆品种苗期抗旱性鉴定[J]. 作物学报, 2015, 41(06): 963-971. |
| [11] | 于爱忠,柴强*. 供水与地膜覆盖对干旱灌区玉米产量的影响[J]. 作物学报, 2015, 41(05): 778-786. |
| [12] | 胡凝,吕川根,姚克敏,张晓翠. 利用鱼眼影像技术反演不同株型水稻的冠层结构参数[J]. 作物学报, 2014, 40(08): 1443-1451. |
| [13] | 张宁, 齐波,赵晋铭,张小燕,王素阁,赵团结,盖钧镒. 应用主动传感器GreenSeeker估测大豆籽粒产量[J]. 作物学报, 2014, 40(04): 657-666. |
| [14] | 孙雪芳,丁在松,侯海鹏,葛均筑,唐丽媛,赵明. 不同春玉米品种花后光合物质生产特点及碳氮含量变化[J]. 作物学报, 2013, 39(07): 1284-1292. |
| [15] | 吴琼,齐波,赵团结,姚鑫锋,朱艳,盖钧镒. 高光谱遥感估测大豆冠层生长和籽粒产量的探讨[J]. 作物学报, 2013, 39(02): 309-318. |
|
||