欢迎访问作物学报,今天是
作物学报 ›› 2022, Vol. 48 ›› Issue (7): 1746-1760.doi: 10.3724/SP.J.1006.2022.11053
张少华1( ), 段剑钊1,2, 贺利1, 井宇航1, 郭天财1, 王永华1, 冯伟1,*()
ZHANG Shao-Hua1(), DUAN Jian-Zhao1,2, HE Li1, JING Yu-Hang1, Urs Christoph Schulthess2,*(), Azam Lashkari1,2, GUO Tian-Cai1, WANG Yong-Hua1, FENG Wei1,*()
摘要:
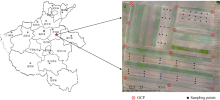
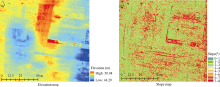
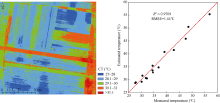
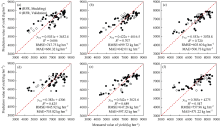
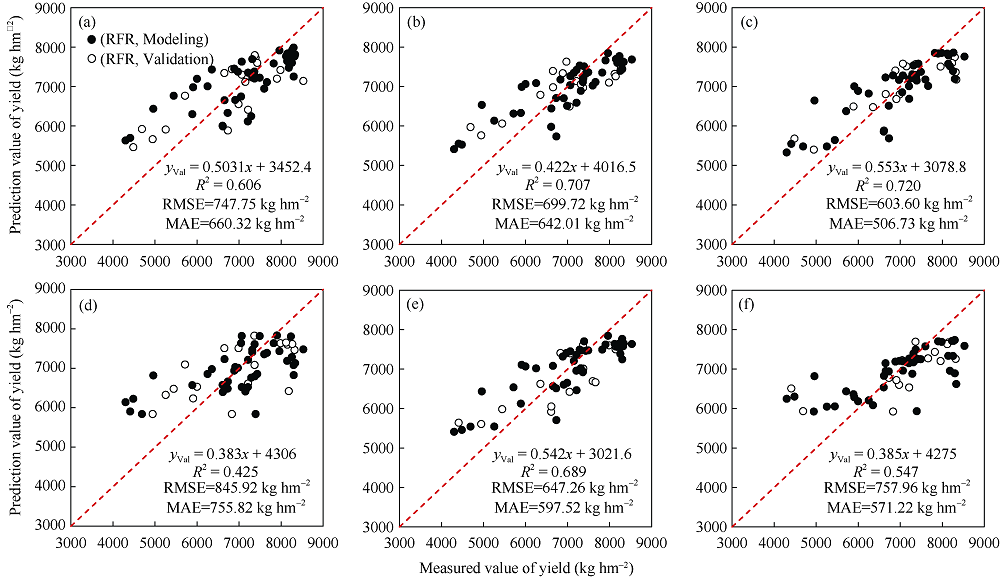
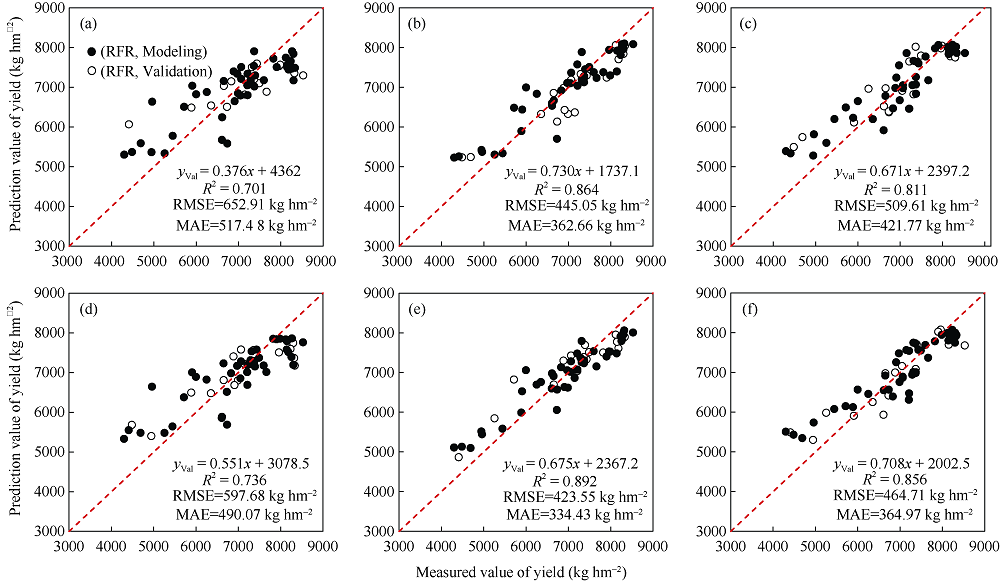
作物产量估测关系到人民生活质量和国家粮食安全问题, 在田块尺度下及时准确估算产量, 对于农事操作管理、收获、销售及种植计划制定均具有重要意义。选择地势起伏及空间差异较大的农田为研究区, 利用低空无人机遥感平台搭载多光谱相机、热红外相机和RGB相机, 同步获取小麦关键生育时期的无人机遥感影像, 并提取光谱反射率、热红外温度和数字高程信息。首先统计不同地形特征下遥感参数和生长指标的空间变异情况, 分析植被指数和温度参数与小麦产量的相关性, 然后利用多元线性回归(multiple linear regression, MLR)、偏最小二乘回归(partial least squares regression, PLSR)、支持向量机回归(support vector machine regression, SVR)和随机森林回归(random forest regression, RFR) 4种机器学习方法以单模态数据和多模态遥感信息融合2种方式进行建模, 比较单模态数据和多模态数据融合的产量估测能力。结果表明, 坡度是影响作物生长和产量的重要因子, 3个生育期内, 不同坡度等级下遥感参数差异明显, 土壤含水量、植株含水量和地上部生物量与坡度的相关性均达显著水平, 植被指数和温度参数与产量的相关性均达显著水平。依据与产量的相关性, 筛选7个植被指数(NDVI、GNDVI、EVI2、OSAVI、SAVI、NDRE、WDRVI)和2个温度参数(NRCT、CTD)作为模型输入变量, 对于单模态数据而言, 对产量的估算效应为植被指数 > 温度参数, 以灌浆期植被指数的RFR模型效果最好(R2=0.724, RMSE=614.72 kg hm-2, MAE=478.08 kg hm-2); 对于双模态数据融合来说, 在植被指数基础上融入冠层温度参数表现最好, 开花期RFR模型效果进一步提高(R2=0.865, RMSE=440.73 kg hm-2, MAE=374.86 kg hm-2); 在双模态数据基础上引入坡度信息进行三模态数据融合, 其产量估算效果明显优于单模态和双模态数据融合, 其中以开花期植被指数、温度参数和坡度信息融合的RFR估算效果最好(R2=0.893, RMSE=420.06 kg hm-2, MAE=352.69 kg hm-2), 模型验证效果较好(R2= 0.892, RMSE=423.55 kg hm-2, MAE=334.43 kg hm-2)。可见, 在本试验条件下通过引入地形因子, 结合随机森林回归算法将多模态数据有效融合, 可充分发挥不同遥感信息源之间互补协同作用, 有效提高了产量估算模型的精度与稳定性, 为作物生长监测及产量估算提供思路参考和方法支持。
| [1] |
He L, Asseng S, Zhao G, Wu D R, Yang X Y, Zhuang W, Jin N, Yu Q. Impacts of recent climate warming, cultivar changes, and crop management on winter wheat phenology across the Loess Plateau of China. Agric Forest Meteorol, 2015, 200: 135-143.
doi: 10.1016/j.agrformet.2014.09.011 |
| [2] |
Mueller N, Gerber J S, Johnston M, Ray D K, Ramankutty N, Foley J A. Closing yield gaps through nutrient and water management. Nature, 2012, 490: 254-257.
doi: 10.1038/nature11420 |
| [3] | 杨绚, 汤绪, 陈葆德, 田展, 赵思健. 利用CMIP5多模式集合模拟气候变化对中国小麦产量的影响. 中国农业科学, 2014, 47: 3009-3024. |
| Yang X, Tang X, Chen B D, Tian Z, Zhao S J. Impacts of climate change on wheat yield in China simulated by CMIP5 multi-model ensemble projections. Sci Agric Sin, 2014, 47: 3009-3024. (in Chinese with English abstract) | |
| [4] |
Reshef I B, Vermote E, Lindeman M, Justice C. A generalized regression-based model for forecasting winter wheat yields in Kansas and Ukraine using MODIS data. Remote Sens Environ, 2010, 114: 1312-1323.
doi: 10.1016/j.rse.2010.01.010 |
| [5] |
Zaman-Allah M, Vergara O, Araus J L, Tarekegne A, Magorokosho C, Zarco-Tejada P J, Hornero A, Albà A H, Das B, Craufurd P, Olsen M, Prasanna B M, Cairns J. Unmanned aerial platform-based multi-spectral imaging for field phenotyping of maize. Plant Methods, 2015, 11: 35.
doi: 10.1186/s13007-015-0078-2 pmid: 26106438 |
| [6] |
Wang L G, Tian Y G, Yao X, Zhu Y, Cao W X. Predicting grain yield and protein content in wheat by fusing multisensory and multi-temporal remote-sensing images. Field Crops Res, 2014, 164: 178-188.
doi: 10.1016/j.fcr.2014.05.001 |
| [7] | 纪景纯, 赵原, 邹晓娟, 宣可凡, 王伟鹏, 刘建立, 李晓鹏. 无人机遥感在农田信息监测中的应用进展. 土壤学报, 2019, 56: 773-784. |
| Ji J C, Zhao Y, Zou X J, Xuan K F, Wang W P, Liu J L, Li X P. Advancement in application of UAV remote sensing to monitoring of farmlands. Acta Pedol Sin, 2019, 56: 773-784. (in Chinese with English abstract) | |
| [8] | 胡健波, 张健. 无人机遥感在生态学中的应用进展. 生态学报, 2018, 38: 20-30. |
| Hu J B, Zhang J. Unmanned aerial vehicle remote sensing in ecology: advances and prospects. Acta Ecol Sin, 2018, 38: 20-30. (in Chinese with English abstract) | |
| [9] | 孙刚, 黄文江, 陈鹏飞, 高帅, 王秀. 轻小型无人机多光谱遥感技术应用进展. 农业机械学报, 2018, 49(3): 1-17. |
| Sun G, Huang W J, Chen P F, Gao S, Wang X. Advances in UAV-based multispectral remote sensing applications. Trans CSAM, 2018, 49(3): 1-17. (in Chinese with English abstract) | |
| [10] | 裴浩杰, 冯海宽, 李长春, 金秀良, 李振海, 杨贵军. 基于综合指标的冬小麦长势无人机遥感监测. 农业工程学报, 2017, 33(20): 74-82. |
| Pei H J, Feng H K, Li C C, Jin X L, Li Z H, Yang Z J. Remote sensing monitoring of winter wheat growth with UAV based on comprehensive index. Trans CSAE, 2017, 33(20): 74-82. (in Chinese with English abstract) | |
| [11] |
Navarro A, Young M, Allan B, Carnell P, Macreadie P, Ierodiaconou D. The application of unmanned aerial vehicles (UAVs) to estimate aboveground biomass of mangrove ecosystems. Remote Sens Environ, 2020, 242: 111747.
doi: 10.1016/j.rse.2020.111747 |
| [12] |
Zhang C H, Kovacs J M. The application of small unmanned aerial systems for precision agriculture: a review. Precis Agric, 2012, 13: 693-712.
doi: 10.1007/s11119-012-9274-5 |
| [13] | 朱婉雪, 李仕冀, 张旭博, 李洋, 孙志刚. 基于无人机遥感植被指数优选的田块尺度冬小麦估产. 农业工程学报, 2018, 34(11): 78-86. |
| Zhu W X, Li S J, Zhang X B, Li Y, Sun Z G. Estimation of winter wheat yield using optimal vegetation indices from unmanned aerial vehicle remote sensing. Trans CSAE, 2018, 34(11): 78-86. (in Chinese with English abstract) | |
| [14] | 程千, 徐洪刚, 曹引波, 段福义, 陈震. 基于无人机多时相植被指数的冬小麦产量估测. 农业机械学报, 2021, 52(3): 160-167. |
| Cheng Q, Xu H G, Cao Y B, Duan F Y, Chen Z. Grain yield prediction of winter wheat using multi-temporal UAV based multispectral vegetation index. Trans CSAM, 2021, 52(3): 160-167. (in Chinese with English abstract) | |
| [15] | 刘畅, 杨贵军, 李振海, 汤伏全, 王建雯, 张春兰, 张丽妍. 融合无人机光谱信息与纹理信息的冬小麦生物量估测. 中国农业科学, 2018, 51: 3060-3073. |
| Liu C, Yang G J, Li Z H, Tang F Q, Wang J W, Zhang C L, Zhang L Y. Biomass estimation in winter wheat by UAV spectral information and texture information fusion. Sci Agric Sin, 2018, 51: 3060-3073. (in Chinese with English abstract) | |
| [16] |
Fu Y Y, Yang G J, Song X Y, Li Z H, Xu X G, Feng H K, Zhao C J. Improved estimation of winter wheat aboveground biomass using multiscale textures extracted from UAV-based digital images and hyperspectral feature analysis. Remote Sens, 2021, 13: 581.
doi: 10.3390/rs13040581 |
| [17] |
Elsayed S, Elhoweity M, Ibrahim H H, Dewir Y H, Migdadi H M, Schmidhalter U. Thermal imaging and passive reflectance sensing to estimate the water status and grain yield of wheat under different irrigation regimes. Agric Water Manage, 2017, 189: 98-110.
doi: 10.1016/j.agwat.2017.05.001 |
| [18] |
Rischbeck P, Elsayed S, Mistele B, Barmeier G, Heil K, Schmidhalter U. Data fusion of spectral, thermal and canopy height parameters for improved yield prediction of drought stressed spring barley. Eur J Agron, 2016, 78: 44-59.
doi: 10.1016/j.eja.2016.04.013 |
| [19] |
Maimaitijiang M, Sagan V, Sidike P, Hartling S, Esposito F, Fritschi F B. Soybean yield prediction from UAV using multimodal data fusion and deep learning. Remote Sens Environ, 2020, 237: 111599.
doi: 10.1016/j.rse.2019.111599 |
| [20] | Riihimäki H, Heiskanen J, Luoto M. The effect of topography on arctic-alpine aboveground biomass and NDVI patterns. Int J Appl Earth Obs, 2017, 56: 44-53. |
| [21] |
Nie X D, Guo W, Huang B, Zhuo M N, Li D Q, Li Z W, Yuan Z J. Effects of soil properties, topography and landform on the understory biomass of a pine forest in a subtropical hilly region. Catena (Giessen), 2019, 176: 104-111.
doi: 10.1016/j.catena.2019.01.007 |
| [22] |
Yang Q Y, Jiang Z C, Li W J, Li H. Prediction of soil organic matter in peak-cluster depression region using kriging and terrain indices. Soil Tillage Res, 2014, 144: 126-132.
doi: 10.1016/j.still.2014.07.011 |
| [23] | 张新乐, 徐梦园, 刘焕军, 孟令华, 邱政超, 潘越, 谢雅慧. 引入地形因子的黑土区大豆干生物量遥感反演模型及验证. 农业工程学报, 2017, 33(16): 168-173. |
| Zhang X L, Xu M Y, Liu H J, Meng L H, Qiu Z C, Pan Y, Xie Y H. Remote sensing inversion models and validation of aboveground biomass in soybean with introduction of terrain factors in black soil area. Trans CSAE, 2017, 33(16): 168-173. (in Chinese with English abstract) | |
| [24] | 侯淑涛, 崔杨, 孟令华, 武丹茜, 钱蕾, 鲍依临, 叶强, 刘焕军. 地形对漫川漫岗黑土区大豆产量的影响. 农业工程学报, 2020, 36(8): 88-95. |
| Hou S T, Cui Y, Meng L H, Wu D Q, Qian L, Bao Y L, Ye Q, Liu H J. Effects of terrain on soybean yields in rolling hilly black soil areas. Trans CSAE, 2020, 36(8): 88-95. (in Chinese with English abstract) | |
| [25] |
Qi J, Kerr Y, Moran M, Weltz M, Huete A, Sorooshian S, Bryant R. Leaf area index estimates using remotely sensed data and BRDF models in a semiarid region. Remote Sens Environ, 2000, 73: 18-30.
doi: 10.1016/S0034-4257(99)00113-3 |
| [26] |
Anatoly A G, Mark N M. Remote sensing of chlorophyll concentration in higher plant leaves. Adv Space Res, 1998, 22: 689-692.
doi: 10.1016/S0273-1177(97)01133-2 |
| [27] |
Jiang Z, Huete A R, Didan K, Miurab T. Development of a two-band enhanced vegetation index without a blue band. Remote Sense Environ, 2008, 112: 3833-3845.
doi: 10.1016/j.rse.2008.06.006 |
| [28] |
Geneviève R, Michael S, Frédéric B, Optimization of soil-adjusted vegetation indices. Remote Sense Environ, 1996, 55: 95-107.
doi: 10.1016/0034-4257(95)00186-7 |
| [29] |
Huete A R. Soil-adjust vegetation index (SAVI). Remote Sense Environ, 1988, 25: 295-309.
doi: 10.1016/0034-4257(88)90106-X |
| [30] |
Githlson A, Merzlyak M N. Spectral reflectance changes associated with autumn senescence of Aesculus hippocastanum L. and Acer platanoides L. leaves. Spectral features and relation to chlorophyll estimation. J Plant Physiol, 1994, 143: 286-292.
doi: 10.1016/S0176-1617(11)81633-0 |
| [31] | Gitelson A A. Wide dynamic range vegetation index for remote quantification of biophysical characteristics of vegetation. J Plant Physiol, 2004, 161: 165-173. |
| [32] |
Chen J M. Evaluation of vegetation indices and a modified simple ratio for boreal applications. Can J Remote Sens, 2014, 22: 229-242.
doi: 10.1080/07038992.1996.10855178 |
| [33] |
Daughtry C S T, Walthall C L, Kim M S, Colstoun E B D, McMurtrey J E. Estimating corn leaf chlorophyll concentration from leaf and canopy reflectance. Remote Sense Environ, 2000, 74: 229-239.
doi: 10.1016/S0034-4257(00)00113-9 |
| [34] |
Tucker C J. Red and photographic infrared linear combinations for monitoring vegetation. Remote Sense Environ, 1979, 8: 127-150.
doi: 10.1016/0034-4257(79)90013-0 |
| [35] |
Elsayed S, Rischbeck P, Schmidhalter U. Comparing the performance of active and passive reflectance sensors to assess the normalized relative canopy temperature and grain yield of drought-stressed barley cultivars. Field Crops Res, 2015, 177: 148-160.
doi: 10.1016/j.fcr.2015.03.010 |
| [36] |
Purushothaman R, Thudi M, Krishnamurthy L, Upadhyayaa H D, Kashiwagib J, Gowdaa C L L, Varshney R K. Association of mid-reproductive stage canopy temperature depression with the molecular markers and grain yields of chickpea (Cicer arietinum L.) germplasm under terminal drought. Field Crops Res, 2015, 174: 1-11.
doi: 10.1016/j.fcr.2015.01.007 |
| [37] |
Valtera M, Šamonil, Svoboda M, Janda P. Effects of topography and forest stand dynamics on soil morphology in three natural Picea abies mountain forests. Plant Soil, 2015, 392: 57-69.
doi: 10.1007/s11104-015-2442-4 |
| [38] | 马雨阳, 官海翔, 杨昊轩, 邵帅, 邵逸群, 刘焕军. 利用地形、 土壤和作物信息辅助提高东北漫岗地数字高程模型精度的新方法. 中国农业科学, 2021, 54: 1715-1727. |
| Ma Y Y, Guan H X, Yang H X, Shao S, Shao Y Q, Liu H J. A new method to improve the accuracy of digital elevation model in northeast China by using terrain, soil and crop Information. Sci Agric Sin, 2021, 54: 1715-1727 (in Chinese with English abstract). | |
| [39] | 朱高龙, 柳艺博, 居为民, 陈镜明. 4种常用植被指数的地形效应评估. 遥感学报, 2013, 17: 210-234. |
| Zhu G L, Liu Y B, Ju W M, Chen J M. Evaluation of topographic effects on four commonly used vegetation indices. J Remote Sens, 2013, 17: 210-234. (in Chinese with English abstract) | |
| [40] | 刘海丰, 薛达元, 桑卫国. 地形因子对暖温带森林群落物种丰富度-地上生物量关系的影响. 生态环境学报, 2012, 21: 1403-1407. |
| Liu H F, Xue D Y, Sang W G. Effect of topographic factors on the relationship between species richness and aboveground biomass in a warm temperate forest. Ecol Environ Sci, 2012, 21: 1403-1407. (in Chinese with English abstract) | |
| [41] |
Takyu M, Aiba S I, Kitayama K. Changes in biomass, productivity and decomposition along topographical gradients under different geological conditions in tropical lower montane forests on mount Kinabalu, Borneo. Oecologia, 2003, 134: 397-404.
doi: 10.1007/s00442-002-1115-1 |
| [42] | 杨仕曦, 吕广斌, 黄云, 向华辉, 王正银. 九龙坡花椒种植区地形、土壤肥力与花椒产量的关系. 中国生态农业学报, 2019, 27: 1823-1832. |
| Yang S X, Lyu G B, Huang Y, Xiang H H, Wang Z Y. Relationships of Zanthoxylum bungeanum yield with topography and soil fertility in Jiulongpo area. Chin J Eco-Agric, 2019, 27: 1823-1832. (in Chinese with English abstract) | |
| [43] | Kross A, Mcnairn H, Lapen D, Sunohara M, Champagne C. Assessment of rapid eye vegetation indices for estimation of leaf area index and biomass in corn and soybean crops. Int J Appl Earth Obs, 2015, 34: 235-248. |
| [44] |
Guo J X, Tian G L, Zhou Y, Wang M, Ling N, Shen Q R, Guo S W. Evaluation of the grain yield and nitrogen nutrient status of wheat (Triticum aestivum L.) using thermal imaging. Field Crops Res, 2016, 196: 463-472.
doi: 10.1016/j.fcr.2016.08.008 |
| [45] |
Hou A, Chen P, Alloatti J, Li D, Mozzoni L, Zhang B, Shi A. Genetic variability of seed sugar content in worldwide soybean germplasm ppubs. Crop Sci, 2009, 49: 903-912.
doi: 10.2135/cropsci2008.05.0256 |
| [46] |
Virlet N, Lebourgeois V, Martinez S, Costes E, Labbe S, Regnard J L. Stress indicators based on airborne thermal imagery for field phenotyping a heterogeneous tree population for response to water constraints. J Exp Bot, 2014, 65: 5429-5442.
doi: 10.1093/jxb/eru309 |
| [47] | Du W Y., Zhang L D, Hu Z F, Shamaila Z, Zeng A J, Song J L, Liu Y J, Wolfram S, Joachim M, He X K. Utilization of thermal infrared image for inversion of winter wheat yield and biomass. Spectr Spectr Anal, 2011, 31: 1476-1480. |
| [48] |
González F G, Miralles D J, Slafer G A. Wheat floret survival as related to pre-anthesis spike growth. J Exp Bot, 2011, 62: 4889-4901.
doi: 10.1093/jxb/err182 |
| [49] |
Laurent A, Loyce C, Makowski D, Pelzer E. Using site-specific data to estimate energy crop yield. Environ Modell Softw, 2015, 74: 104-113.
doi: 10.1016/j.envsoft.2015.09.008 |
| [50] |
Yue J B, Yang G J, Li C C, Li Z H, Wang Y J, Feng H K, Xu B. Estimation of winter wheat above-ground biomass using unmanned aerial vehicle-based snapshot hyperspectral sensor and crop height improved models. Remote Sens, 2017, 9: 708.
doi: 10.3390/rs9070708 |
| [51] | 陶惠林, 徐良骥, 冯海宽, 杨贵军, 杨小冬, 苗梦珂, 代阳. 基于无人机数码影像的冬小麦株高和生物量估算. 农业工程学报, 2019, 35(19): 107-116. |
| Tao H L, Xu L J, Feng H K, Yang G J, Yang X D, Miao M K, Dai Y. Estimation of plant height and biomass of winter wheat based on UAV digital image. Trans CSAE, 2019, 35(19): 107-116. (in Chinese with English abstract) | |
| [52] | 潘治利, 祁萌, 魏春阳, 李锋, 张仕祥, 王建伟, 过伟民, 艾志录. 基于图像处理和支持向量机的初烤烟叶颜色特征区域分类. 作物学报, 2012, 38: 374-379. |
|
Pan Z L, Qi M, Wei C Y, Li F, Zhang S X, Wang J W, Guo W M, Ai Z L. Color region classification of flue-cured tobacco leaves based on the image. Acta Agron Sin, 2012, 38: 374-379. (in Chinese with English abstract)
doi: 10.3724/SP.J.1006.2012.00374 |
|
| [53] |
Xu J X, Ma J, Tang Y N, Wu W X, Shao J H, Wu W B, Wei S Y, Liu Y F, Wang Y C, Guo H Q. Estimation of sugarcane yield using a machine learning approach based on UAV-LiDAR data. Remote Sens, 2020, 12: 2823.
doi: 10.3390/rs12172823 |
| [54] |
Nawar S, Buddenbaum H, Hill J, Kozak J. Modeling and mapping of soil salinity with reflectance spectroscopy and landsat data using two quantitative methods (PLSR and MARS). Remote Sens, 2014, 6: 10813-10834.
doi: 10.3390/rs61110813 |
| [55] |
Liu H Z, Shi T Z, Chen Y Y, Wang J J, Fei T, Wu G F. Improving spectral estimation of soil organic carbon content through semi-supervised regression. Remote Sens, 2017, 9: 29.
doi: 10.3390/rs9010029 |
| [56] | Aghighi H, Azadbakht M, Ashourloo D, Shahrabi H S, Radiom S.Machine learning regression techniques for the silage maize yield prediction using time-series images of Landsat 8 OLI. IEEE J-Selec Topic Appl Earth Observ Remote Sens, 2018, 11: 4563-4577. |
| [57] | 杨北萍, 陈圣波, 于海洋, 安秦. 基于随机森林回归方法的水稻产量遥感估算. 中国农业大学报, 2020, 25(6): 26-34. |
| Yang B P, Chen S B, Yu H Y, An Q. Remote sensing estimation of rice yield based on random forest regression method. J China Agric Univ, 2020, 25(6): 26-34 (in Chinese with English abstract). | |
| [58] |
Jeong J H, Resop J P, Mueller N D, Fleisher D H, Yun K, Butler E E, Timlin D J, Shim K M, Gerber J S, Reddy V R, Kim S H. Random forests for global and regional crop yield predictions. PLoS One, 2016, 11: e0156571.
doi: 10.1371/journal.pone.0156571 |
| [1] | 郭星宇, 刘朋召, 王瑞, 王小利, 李军. 旱地冬小麦产量、氮肥利用率及土壤氮素平衡对降水年型与施氮量的响应[J]. 作物学报, 2022, 48(5): 1262-1272. |
| [2] | 王洋洋, 贺利, 任德超, 段剑钊, 胡新, 刘万代, 郭天财, 王永华, 冯伟. 基于主成分-聚类分析的不同水分冬小麦晚霜冻害评价[J]. 作物学报, 2022, 48(2): 448-462. |
| [3] | 张建, 谢田晋, 尉晓楠, 王宗铠, 刘崇涛, 周广生, 汪波. 无人机多角度成像方式的饲料油菜生物量估算研究[J]. 作物学报, 2021, 47(9): 1816-1823. |
| [4] | 张矞勋, 齐拓野, 孙源, 璩向宁, 曹媛, 吴梦瑶, 刘春虹, 王磊. 高分六号遥感影像植被特征及其在冬小麦苗期LAI反演中的应用[J]. 作物学报, 2021, 47(12): 2532-2540. |
| [5] | 胡鑫慧, 谷淑波, 朱俊科, 王东. 分期施钾对不同质地土壤麦田冬小麦干物质积累和产量的影响[J]. 作物学报, 2021, 47(11): 2258-2267. |
| [6] | 周宝元, 葛均筑, 孙雪芳, 韩玉玲, 马玮, 丁在松, 李从锋, 赵明. 黄淮海麦玉两熟区周年光温资源优化配置研究进展[J]. 作物学报, 2021, 47(10): 1843-1853. |
| [7] | 付虹雨, 崔国贤, 李绪孟, 佘玮, 崔丹丹, 赵亮, 苏小惠, 王继龙, 曹晓兰, 刘婕仪, 刘皖慧, 王昕惠. 基于无人机遥感图像的苎麻产量估测研究[J]. 作物学报, 2020, 46(9): 1448-1455. |
| [8] | 陈鹏飞,徐新刚. 无人机影像拼接软件在农业中应用的比较研究[J]. 作物学报, 2020, 46(7): 1112-1119. |
| [9] | 雒文鹤, 师祖姣, 王旭敏, 李军, 王瑞. 节水减氮对土壤硝态氮分布和冬小麦水氮利用效率的影响[J]. 作物学报, 2020, 46(6): 924-936. |
| [10] | 马艳明, 冯智宇, 王威, 张胜军, 郭营, 倪中福, 刘杰. 新疆冬小麦品种农艺及产量性状遗传多样性分析[J]. 作物学报, 2020, 46(12): 1997-2007. |
| [11] | 马艳明, 娄鸿耀, 陈朝燕, 肖菁, 徐麟, 倪中福, 刘杰. 新疆冬小麦地方品种与育成品种基于SNP芯片的遗传多样性分析[J]. 作物学报, 2020, 46(10): 1539-1556. |
| [12] | 张力,陈阜,雷永登. 近60年河北省冬小麦干旱风险时空规律[J]. 作物学报, 2019, 45(9): 1407-1415. |
| [13] | 吴亚鹏,贺利,王洋洋,刘北城,王永华,郭天财,冯伟. 冬小麦生物量及氮积累量的植被指数动态模型研究[J]. 作物学报, 2019, 45(8): 1238-1249. |
| [14] | 姜丽娜,马静丽,方保停,马建辉,李春喜,王志敏,蒿宝珍. 限水减氮对豫北冬小麦产量和植株不同层次器官干物质运转的影响[J]. 作物学报, 2019, 45(6): 957-966. |
| [15] | 何昕楠,林祥,谷淑波,王东. 微喷补灌对麦田土壤物理性状及冬小麦耗水和产量的影响[J]. 作物学报, 2019, 45(6): 879-892. |
|