欢迎访问作物学报,今天是
作物学报 ›› 2022, Vol. 48 ›› Issue (9): 2300-2314.doi: 10.3724/SP.J.1006.2022.11089
冯子恒1,2( ), 李晓3,*(), 段剑钊2, 高飞4, 贺利2, 杨天聪2, 戎亚思2, 宋莉2, 尹飞1, 冯伟2
FENG Zi-Heng1,2(), LI Xiao3,*(), DUAN Jian-Zhao2, GAO Fei4, HE Li2, YANG Tian-Chong2, RONG Ya-Si2, SONG Li2, YIN Fei1, FENG Wei2
摘要:
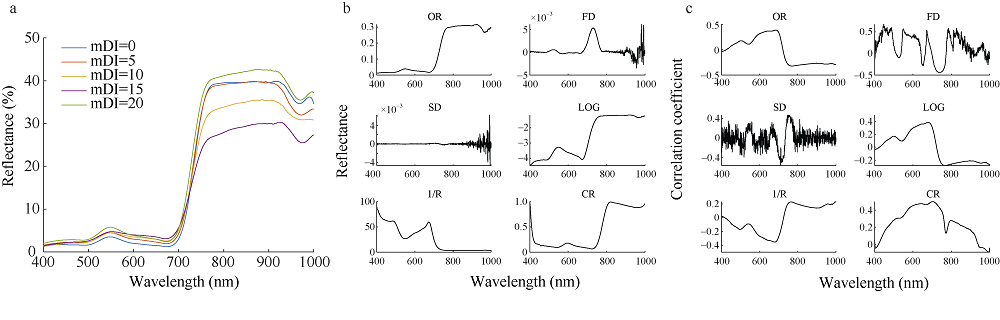
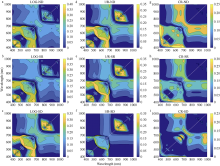
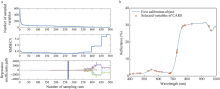
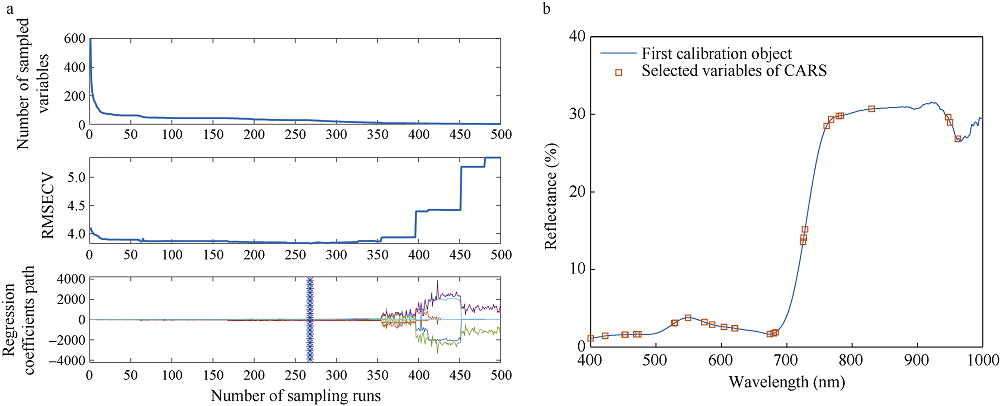
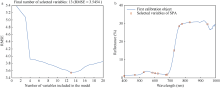
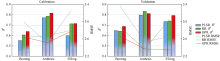
白粉病严重危害小麦生长及制约产量形成, 精确监测该病害对精确防控及保障国家粮食安全具有重要意义。在小麦孕穗、开花和灌浆期使用地物高光谱仪获取小麦冠层光谱数据, 利用一阶导数(FD)、二阶导数(SD)、对数变换(LOG)、倒数变换(1/R)和连续去除法(CR)对原始光谱(OR)进行光谱变换, 基于CARS算法和SPA算法相结合对五种变换的光谱数据和原始光谱进行特征波段提取, 进而利用偏最小二乘回归(PLSR)、岭回归(RR)和高斯过程回归(GPR)建模方法确立小麦白粉病病情指数(mDI)监测模型。结果表明, 一阶导数在Pearson相关性、两波段优化组合以及机器学习方法建模中, 综合表现最好, 是一种处理病害光谱数据的较好预处理方法。经过光谱数据变换后, 再使用CARS-SPA算法可以更有效的提取特征波段, 特征波段为411、450、476、543、561、594、624、671、726、780、835和950 nm。在不同机器学习建模方法对比中, 高斯过程回归(GPR)模型表现最佳, 其次为岭回归(RR)和偏最小二乘法回归(PLSR)。其中, 一阶导数结合GPR模型的估算精度最高, 建模集和验证集的平均R2为0.805, RMSE和MAE分别为2.532和2.164, 相较于OR-GPR模型, R2提升12%, RMSE和MAE分别降低19.6%和17.6%, 表明GPR模型在小麦白粉病监测中具有良好的估算能力。可见, 使用一阶导数预处理光谱数据, 采用CARS-SPA结合算法提取特征波段, 再利用高斯过程回归建模方法能够提升小麦白粉病遥感监测精度。研究结果为实现遥感监测作物病害提供了思路与方法。
| [1] |
Zhang N, Yang G, Pan Y, Yang X, Chen L, Zhao C. A review of advanced technologies and development for hyperspectral-based plant disease detection in the past three decades. Remote Sens, 2020, 12: 3188.
doi: 10.3390/rs12193188 |
| [2] | 黄文江, 师越, 董莹莹, 叶回春, 邬明权, 崔贝, 刘林毅. 作物病虫害遥感监测研究进展与展望. 智慧农业, 2019, 1(4): 1-11. |
| Huang W J, Shi Y, Dong Y Y, Ye H C, Wu M Q, Cui B, Liu L Y. Progress and prospects of crop diseases and pests monitoring by remote sensing. Smart Agric, 2019, 1(4): 1-11 (in Chinese with English abstract) | |
| [3] |
Feng W, Qi S, Heng Y R, Zhou L, Wu Y P, Liu W D, He L, Li X. Canopy vegetation indices from in situ hyperspectral data to assess plant water status of winter wheat under powdery mildew stress. Front Plant Sci, 2017, 8: 1219.
doi: 10.3389/fpls.2017.01219 pmid: 28751904 |
| [4] |
Shi Y, Huang W J, Gonzalez-Moreno P, Luke B, Dong Y, Zheng Q, Ma H Q, Liu L Y. Wavelet-based rust spectral feature set (WRSFs): a novel spectral feature set based on continuous wavelet transformation for tracking progressive host-pathogen interaction of yellow rust on wheat. Remote Sens, 2018, 10: 525.
doi: 10.3390/rs10040525 |
| [5] | 沈文颖, 李映雪, 冯伟, 张海艳, 张元帅, 谢迎新, 郭天财. 基于因子分析-BP神经网络的小麦叶片白粉病反演模型. 农业工程学报, 2015, 31(22): 183-190. |
| Shen W Y, Li Y X, Feng W, Zhang H Y, Zhang Y S, Xie Y X, Guo T C. Inversion model for severity of powdery mildew in wheat leaves based on factor analysis-BP neural network. Trans CSAE, 2015, 31(22): 183-190 (in Chinese with English abstract) | |
| [6] |
Franceschini M, Bartholomeus H, Apeldoorn D F V, Suomalainen J, Kooistra L. Feasibility of unmanned aerial vehicle optical imagery for early detection and severity assessment of late blight in potato. Remote Sens, 2019, 11: 224.
doi: 10.3390/rs11030224 |
| [7] |
Mahlein A K, Rumpf T, Welke P, Dehne H W, Plumer L, Steiner U, Oerke E C. Development of spectral indices for detecting and identifying plant diseases. Remote Sens Environ, 2013, 128: 21-30.
doi: 10.1016/j.rse.2012.09.019 |
| [8] |
Feng W, Shen W, He L, Duan J Z, Guo B, Li Y, Wang C Y, Guo T. Improved remote sensing detection of wheat powdery mildew using dual-green vegetation indices. Prec Agric, 2016, 17: 608-627.
doi: 10.1007/s11119-016-9440-2 |
| [9] |
Naidu R A, Perry E M, Pierce F J, Mekuria T. The potential of spectral reflectance technique for the detection of Grapevine leafroll associated virus-3 in two red-berried wine grape cultivars. Comput Electr Agric, 2009, 66: 38-45.
doi: 10.1016/j.compag.2008.11.007 |
| [10] | 兰玉彬, 朱梓豪, 邓小玲, 练碧桢, 黄敬易, 黄梓效, 胡洁. 基于无人机高光谱遥感的柑橘黄龙病植株的监测与分类. 农业工程学报, 2019, 35(3): 92-100. |
| Lan Y B, Zhu Z H, Deng X L, Lian B Z, Huang J Y, Huang Z X, Hu J. Monitoring and classification of citrus Huanglongbing based on UAV hyperspectral remote sensing. Trans CSAE, 2019, 35(3): 92-100 (in Chinese with English abstract) | |
| [11] | Izzuddin A. Analysis of airborne hyperspectral image using vegetation indices, red edge position and continuum removal for detection of ganoderma disease in oil palm. J Oil Palm Res, 2018, 30: 416-428. |
| [12] |
Zarco-Teja P J, Camino C, Beck P, Calderon R, Hornero A, Hernández-Clemente R, Kattenborn T, Montes-Borrego M, Susca L, Morelli M. Previsual symptoms of Xylella fastidiosa infection revealed in spectral plant-trait alterations. Nat Plants, 2018, 4: 432-439.
doi: 10.1038/s41477-018-0189-7 pmid: 29942047 |
| [13] |
Poblete T, Camino C, Beck P, Hornero A, Zarco-Tejada P J. Detection of Xylella fastidiosa infection symptoms with airborne multispectral and thermal imagery: assessing bandset reduction performance from hyperspectral analysis. ISPRS J Photogr Remote Sens, 2020, 162: 27-40.
doi: 10.1016/j.isprsjprs.2020.02.010 |
| [14] |
Ghosal S, Blystone D, Singh A K, Ganapathysubramanian B, Sarkar S. An explainable deep machine vision framework for plant stress phenotyping. Proc Natil Acad Sci USA, 2018, 115: 4613-4618.
doi: 10.1073/pnas.1716999115 |
| [15] | 肖文, 曹英丽, 冯帅, 刘亚帝, 江凯伦, 于正鑫, 闫丽. 基于分窗Gram-Schmidt变换和PSO-SVR算法的水稻纹枯病病情指数检测. 光谱学与光谱分析, 2021, 41: 2181-2187. |
| Xiao W, Cao Y L, Feng S, Liu Y D, Jiang K L, Yu Z X, Yan L. Detection of rice sheath blight disease index based on split-window gram-schmidt transformation and PSO-SVR algorithm. Spectr Spectr Anal, 2021, 41: 2181-2187 (in Chinese with English abstract) | |
| [16] | Moghaddam S, Mokhtarzade M, Beirami B A. A feature extraction method based on spectral segmentation and integration of hyperspectral images. Int J Appl Earth Observ Geoinform, 2020, 89: 102097. |
| [17] | Huang Y, Li Z L, Risinger A L, Enslow B T, Zeman C J, Gong J, Yang Y J, Schanze K S. Fluorescence spectral shape analysis for nucleotide identification. Proc Natl Acad Sci USA, 2019, 116: 2018207113. |
| [18] | Maimaitijiang M, Sagan V, Sidike P, Hartling S, Fritschi F B. Soybean yield prediction from UAV using multimodal data fusion and deep learning. Remote Sens Environ, 2019, 237: 111599. |
| [19] |
Hu Q, Sulla-Menashe D, Xu B D, Yin H, Tang H J, Yang P, Wu W B. A phenology-based spectral and temporal feature selection method for crop mapping from satellite time series. Int J Appl Earth Observ Geoinform, 2019, 80: 218-229.
doi: 10.1016/j.jag.2019.04.014 |
| [20] | Tian L, Xue B W, Wang Z Y, Li D, Yao X, Cao Q, Zhu Y, Cao W X, Cheng T. Spectroscopic detection of rice leaf blast infection from asymptomatic to mild stages with integrated machine learning and feature selection. Remote Sens Environ, 2021, 257: 112350. |
| [21] |
Feng W, Wu Y P, He L, Ren X, Wang Y, Hou G, Wang Y H, Liu W D, Guo T C. An optimized non-linear vegetation index for estimating leaf area index in winter wheat. Prec Agric, 2019, 20: 1157-1176.
doi: 10.1007/s11119-019-09648-8 |
| [22] | 中国农业科学院. 农作物病害遥感监测技术规范第二部分: 小麦白粉病. NY/T2738.2-2015, 2015. |
| Chinese Academy of Agricultural Sciences. Technical Specification on Remote Sensing Monitoring for Crop Diseases-Part 2: Wheat Powder Mildew, NY/T2738.2-2015, 2015. (in Chinese with English abstract) | |
| [23] | Hong G, El-Hamid H T. Hyperspectral imaging using multivariate analysis for simulation and prediction of agricultural crops in Ningxia, China. Comput Electr Agric, 2020, 172: 105355. |
| [24] |
Sun J, Zhou X, Hu Y, Wu X H, Zhang X D, Wang P. Visualizing distribution of moisture content in tea leaves using optimization algorithms and NIR hyperspectral imaging. Comput Electr Agric, 2019, 160: 153-159.
doi: 10.1016/j.compag.2019.03.004 |
| [25] | Jia M, Li W, Wang K, Zhou C, Tian Y C, Zhu Y, Cao W X, Yao X. A newly developed method to extract the optimal hyperspectral feature for monitoring leaf biomass in wheat. Comput Electr Agric, 2019, 165: 104942. |
| [26] |
Ramoelo A, Skidmore A K, Cho M A, Mathieu R, Heitkönig I, Dudeni-Tlhone N, Schlerf M, Prins H H T. Non-linear partial least square regression increases the estimation accuracy of grass nitrogen and phosphorus using in situ hyperspectral and environmental data. ISPRS J Photogra Remote Sens, 2013, 82: 27-40.
doi: 10.1016/j.isprsjprs.2013.04.012 |
| [27] |
Zandler H, Brenning A, Samimi C. Quantifying dwarf shrub biomass in an arid environment: comparing empirical methods in a high dimensional setting. Remote Sens Environ, 2015, 158: 140-155.
doi: 10.1016/j.rse.2014.11.007 |
| [28] | Fernández-Guisuraga J M, Verrelst J, Calvo L, Suárez-Seoane S. Hybrid inversion of radiative transfer models based on high spatial resolution satellite reflectance data improves fractional vegetation cover retrieval in heterogeneous ecological systems after fire. Remote Sens Environ, 2021, 255: 112304. |
| [29] |
Gamon J, Penuelas J, Field C. A narrow-waveband spectral index that tracks diurnal changes in photosynthetic efficiency. Remote Sens Environ, 1992, 41(1): 35-44.
doi: 10.1016/0034-4257(92)90059-S |
| [30] | Penuelas J, Frédéric B, Filella I. Semi-empirical indices to assess carotenoids/chlorophyll A ratio from leaf spectral reflectance. Photosynthetica, 1995, 31: 221-230. |
| [31] |
Gitelson A A, Merzlyak M N, Chivkunova O B. Optical properties and nondestructive estimation of anthocyanin content in plant leaves. Photochem Photobiol, 2010, 74: 38-45.
doi: 10.1562/0031-8655(2001)074<0038:OPANEO>2.0.CO;2 |
| [32] |
Liu L, Huang W, Pu R, Wang J. Detection of internal leaf structure deterioration using a new spectral ratio index in the near-infrared shoulder region. J Integr Agric, 2014, 13: 760-769.
doi: 10.1016/S2095-3119(13)60385-8 |
| [33] |
Huang L S, Ding W J, Liu W J, Zhao J L, Huang W J, Xu C, Zhang D Y, Liang D. Identification of wheat powdery mildew using in-situ hyperspectral data and linear regression and support vector machines. J Plant Pathol, 2019, 101: 1035-1045.
doi: 10.1007/s42161-019-00334-2 |
| [34] |
He L, Qi S L, Duan J Z, Guo T C, Feng W, He D X. Monitoring of wheat powdery mildew disease severity using multiangle hyperspectral remote sensing. IEEE Trans Geosci Remot Sens, 2020, 59: 979-990.
doi: 10.1109/TGRS.2020.3000992 |
| [35] | 谢亚平, 陈丰农, 张竞成, 周斌, 王海江, 吴开华. 基于高光谱技术的农作物常见病害监测研究. 光谱学与光谱分析, 2018, 38: 2233-2240. |
| Xie Y P, Chen F N, Zhang J C, Zhou B, Wang H J, Wu K H. Study on monitoring of common diseases of crops based on hyperspectral technology. Spectr Spectr Anal, 2018, 38: 2233-2240 (in Chinese with English abstract) | |
| [36] | Graeff S, Link J, Claupein W. Identification of powdery mildew (Erysiphe graminis sp. tritici) and take-all disease (Gaeumannomyces graminis sp. tritici) in wheat (Triticum aestivum L.) by means of leaf reflectance measurements. Centr Eur J Biol, 2006, 1: 275-288. |
| [37] | 冯伟, 王晓宇, 宋晓, 贺利, 王永华, 郭天财. 基于冠层反射光谱的小麦白粉病严重度估测. 作物学报, 2013, 39: 1469-1477. |
|
Feng W, Wang X Y, Song X, He L, Wang Y H, Guo T C. Estimation of severity level of wheat powdery mildew based on canopy spectral reflectance. Acta Agron Sin, 2013, 39: 1469-1477 (in Chinese with English abstract)
doi: 10.3724/SP.J.1006.2013.01469 |
|
| [38] | 汪六三, 黄子良, 王儒敬. 基于近红外光谱和机器学习的大豆种皮裂纹识别研究. 农业机械学报, 2021, 52(6): 361-368. |
| Wang L S, Huang Z L, Wang R J. Identification of soybean seed coat crack based on near infrared spectroscopy and machine learning. Trans CSAM, 2021, 52(6): 361-368 (in Chinese with English abstract) | |
| [39] | 张娟娟, 席磊, 杨向阳, 许鑫, 郭伟, 程涛, 马新明. 砂姜黑土有机质含量高光谱估测模型构建. 农业工程学报, 2020, 36(17): 135-141. |
| Zhang J J, Xi L, Yang X Y, Xu X, Guo W, Cheng T, Ma X M. Construction of hyperspectral estimation model for organic matter content in Shajiang black soil. Trans CSAE, 2020, 36(17): 135-141 (in Chinese with English abstract) | |
| [40] |
Gao J L, Meng B P, Liang T G, Feng Q S, Ge J, Yin J P, Wu C X, Cui X, Hou M J, Liu J, Xie H J. Modeling alpine grassland forage phosphorus based on hyperspectral remote sensing and a multi-factor machine learning algorithm in the east of Tibetan Plateau, China. ISPRS J Photogr Remote Sens, 2019, 147: 104-117.
doi: 10.1016/j.isprsjprs.2018.11.015 |
| [41] |
Jie P, Ju Y W, Zhang H, Wang X T. Detection of Bursaphelenchus xylophilus infection in Pinus massoniana from hyperspectral data. Nematology, 2014, 16: 1197-1207.
doi: 10.1163/15685411-00002846 |
| [42] |
Zhao J, Fang Y, Chu G, Yan H, Hu L, Huang L. Identification of leaf-scale wheat powdery mildew (Blumeria graminis f. sp. tritici) Combining hyperspectral imaging and an SVM classifier. Plants, 2020, 9: 936.
doi: 10.3390/plants9080936 |
| [43] |
Pane C, Manganiello G, Nicastro N, Cardi T, Carotenuto F. Powdery mildew caused by Erysiphe cruciferarum on wild rocket (Diplotaxis tenuifolia): hyperspectral imaging and machine learning modeling for non-destructive disease detection. Agriculture, 2021, 11: 337.
doi: 10.3390/agriculture11040337 |
| [44] |
Yuan L, Huang Y B, Loraamm R W, Nie C W, Wang J H, Zhang J C. Spectral analysis of winter wheat leaves for detection and differentiation of diseases and insects. Field Crops Res, 2014, 156: 199-207.
doi: 10.1016/j.fcr.2013.11.012 |
| [45] |
Zhang J, Cheng T, Guo W, Xu X, Qiao H B, Xie Y M, Ma X M. Leaf area index estimation model for UAV image hyperspectral data based on wavelength variable selection and machine learning methods. Plant Methods, 2021, 17: 49.
doi: 10.1186/s13007-021-00750-5 |
| [46] | 刘畅, 杨贵军, 李振海, 汤伏全, 王建雯, 张春兰, 张丽妍. 融合无人机光谱信息与纹理信息的冬小麦生物量估测. 中国农业科学, 2018, 51: 3060-3073. |
| Liu C, Yang G J, Li Z H, Tang F Q, Wang J W, Zhang C L, Zhang L Y. Biomass estimation in winter wheat by UAV spectral information and texture information fusion. Sci Agric Sin, 2018, 51: 3060-3073 (in Chinese with English abstract) | |
| [47] |
Han Z, Deng L. Application driven key wavelengths mining method for aflatoxin detection using hyperspectral data. Comput Electr Agric, 2018, 153: 248-255.
doi: 10.1016/j.compag.2018.08.018 |
| [48] |
Zheng Q, Huang W J, Cui X M, Shi Y, Liu L Y. New spectral index for detecting wheat yellow rust using sentinel-2 multispectral imagery. Sensors, 2018, 18: 868.
doi: 10.3390/s18030868 |
| [49] |
Chan A, Barnes C, Swinfield T, Coomes D. Monitoring ash dieback (Hymenoscyphus fraxineus) in British forests using hyperspectral remote sensing. Remote Sens Ecol Conserv, 2020, 7: 306-320.
doi: 10.1002/rse2.190 |
| [50] | Xie R, Darvishzadeh R, Skidmore A K, Heurich M, Holzwarth S, Gara W, Reusen I. Mapping leaf area index in a mixed temperate forest using Fenix airborne hyperspectral data and Gaussian processes regression. Int J Appl Earth Observ Geoinform, 2021, 95: 102242. |
| [51] |
Verrelst J, Rivera-Caicedo P, Reyes-Muñoz P, Morata M, Amin E, Tagliabue G, Panigada C, Hank T, Berger K. Mapping landscape canopy nitrogen content from space using PRISMA data. ISPRS J Photogr Remote Sens, 2021, 178: 382-395.
doi: 10.1016/j.isprsjprs.2021.06.017 |
| [1] | 李金敏, 陈秀青, 杨琦, 史良胜. 基于高光谱的水稻叶片氮含量估计的深度森林模型研究[J]. 作物学报, 2021, 47(7): 1342-1350. |
| [2] | 竞霞, 邹琴, 白宗璠, 黄文江. 基于反射光谱和叶绿素荧光数据的作物病害遥感监测研究进展[J]. 作物学报, 2021, 47(11): 2067-2079. |
| [3] | 王利民,杨玲波,刘佳,杨福刚,姚保民. GF-1和MODIS影像冬小麦长势监测指标NDVI的对比[J]. 作物学报, 2018, 44(7): 1043-1054. |
| [4] | 王利民, 刘佳, 杨福刚, 杨玲波, 姚保民, 王小龙. 基于GF-1卫星遥感数据识别京津冀冬小麦面积[J]. 作物学报, 2018, 44(05): 762-773. |
| [5] | 姜延涛,许韬,段霞瑜*,周益林. 品种混种控制小麦白粉病及其对小麦产量和蛋白质含量的影响[J]. 作物学报, 2015, 41(02): 276-285. |
| [6] | 冯伟,王晓宇,宋晓,贺利,王永华,郭天财. 基于冠层反射光谱的小麦白粉病严重度估测[J]. 作物学报, 2013, 39(08): 1469-1477. |
| [7] | 邢莉萍,钱晨,李明浩,曹爱忠,王秀娥,陈佩度. 小麦Mlo反义基因的转化及转基因植株的白粉病抗性分析[J]. 作物学报, 2013, 39(03): 431-439. |
| [8] | 陈兵, 王克如, 李少昆, 肖春华, 苏毅, 唐强, 陈江鲁, 金秀良, 吕银亮, 刁万英, 王楷. 棉花黄萎病疑似病田的卫星遥感监测——以TM卫星影像为例[J]. 作物学报, 2012, 38(01): 129-139. |
| [9] | 王华忠, 章珍, 贺洋, 岳洁瑜. 病原侵染早期小麦抗白粉病性状的构成因素剖析和QTL定位分析[J]. 作物学报, 2011, 37(07): 1219-1228. |
| [10] | 章珍, 刘新红, 翟洪翠, 王华忠. 小麦Pm21基因调控的白粉菌早期侵染抑制和寄主细胞反应[J]. 作物学报, 2011, 37(01): 67-73. |
| [11] | 曹世勤, 骆惠生, 武翠平, 金社林, 王晓鸣, 朱振东, 贾秋珍, 黄瑾, 张勃, 尚勋武. 甘肃省主要小麦生产品种(系)及抗源材料抗白粉病基因推导分析[J]. 作物学报, 2010, 36(12): 2107-2115. |
| [12] | 李根桥,房体麟,朱婕,高亮亮,李闪,解超杰,杨作民,孙其信,刘志勇. 普通小麦品种Brock抗白粉病基因分子标记定位[J]. 作物学报, 2009, 35(9): 1613-1619. |
| [13] | 王振英;赵红梅;洪敬欣;陈丽媛;朱婕;李刚;彭永康;解超杰;刘志勇;孙其信;杨作民. 簇毛麦6VS上4个新分子标记的鉴定及与抗白粉病基因Pm21的连锁分析[J]. 作物学报, 2007, 33(04): 605-611. |
| [14] | 柏军华;李少昆;王克如; 王方永; 陈兵;初振东. 棉花产量遥感预测的L-Y模型构建[J]. 作物学报, 2006, 32(06): 840-844. |
| [15] | 高安礼;何华纲;陈全战; 张守忠; 陈佩度. 分子标记辅助选择小麦抗白粉病基因Pm2、Pm4a、Pm21 的聚合体[J]. 作物学报, 2005, 31(11): 1400-1405. |
|
||