Welcome to Acta Agronomica Sinica,
Acta Agronomica Sinica ›› 2022, Vol. 48 ›› Issue (9): 2137-2154.doi: 10.3724/SP.J.1006.2022.11105
• REVIEW • Next Articles
YAN Weikai*( )
)
| [1] | 赵洪璋. 小麦杂交育种工作的若干问题. 甘肃农业科技, 1982, (8): 1-3. |
| Zhao H Z. Several issues in wheat hybridization breeding. Gangsu Agric Sci Technol, 1982, (8): 1-3. (in Chinese) | |
| [2] | 赵洪璋. 小麦杂交育种的基本理论和三大问题. 甘肃农业科技, 1991, (2): 4-5. |
| Zhao H Z. Basic theories and three major issues in wheat hybridization breeding. Gangsu Agric Sci Technol, 1991, (2): 4-5 (in Chinese) | |
| [3] | 赵洪璋, 张海锋, 宋哲民. 小麦杂交育种工作中的若干问题. 陕西农业科学, 1981, (3): 1-8. |
| Zhao H J, Zhang H F, Song Z M. Some issues in wheat hybridization breeding. Shaanxi Agric Sci, 1981, (3): 1-8 (in Chinese) | |
| [4] | Yan W, Tinker N A, Bekele W A, Mitchell-Fetch J, Frégeau-Reid J. Theoretical unification and practical integration of conventional methods and genomic selection in plant breeding. Crop Breed Genet Genomic, 2019, 1: e190003. https://doi.org/10.20900/cbgg20190003. |
| [5] | Yan W. A systematic narration of some key concepts and procedures in plant breeding. Front Plant Sci, 2021, 12: 1863. |
| [6] |
Duvick D N. Plant breeding, an evolutionary concept. Crop Sci, 1996, 36: 539-548.
doi: 10.2135/cropsci1996.0011183X003600030001x |
| [7] |
Rasmusson D C, Phillips R L. Plant breeding progress and genetic diversity from de novo variation and elevated epistasis. Crop Sci, 1997, 37: 303-310.
doi: 10.2135/cropsci1997.0011183X003700020001x |
| [8] | 李振声. 小麦远缘杂交新品种——小偃6号. 山西农业科学, 1986, (5): 30. |
| Li Z S. New wheat cultivar from wide cross: Xiaoyan 6. Shanxi Agric Sci, 1986, (5): 30. (in Chinese) | |
| [9] |
Arrones A, Vilanova S, Plazas M, Mangino G, Pascual L, Díez M J, Prohens J, Gramazio P. The dawn of the age of multi-parent MAGIC populations in plant breeding: novel powerful next- generation resources for genetic analysis and selection of recombinant elite material. Biology, 2020, 9: 229.
doi: 10.3390/biology9080229 |
| [10] |
Heffner E L, Sorrells M E, Jannink J L. Genomic selection for crop improvement. Crop Sci, 2009, 49: 1-12.
doi: 10.2135/cropsci2008.08.0512 |
| [11] |
Jannink J L, Lorenz A J, Iwata H. Genomic selection in plant breeding: from theory to practice. Brief Funct Genom, 2010, 9: 166-177.
doi: 10.1093/bfgp/elq001 |
| [12] |
Heslot N, Jannink J L, Sorrells M E. Perspectives for genomic selection applications and research in plants. Crop Sci, 2015, 55: 1-12.
doi: 10.2135/cropsci2014.03.0249 |
| [13] |
Osthushenrich T, Frisch M, Zenke-Philippi C, Jaiser H, Spiller M, Cselényi L, Krumnacker K, Boxberger S, Kopahnke D, Habekuß A, Ordon F. Prediction of means and variances of crosses with genome-wide marker effects in barley. Front Plant Sci, 2018, 9: 1899.
doi: 10.3389/fpls.2018.01899 pmid: 30627135 |
| [14] |
Wang L, Zhu G, Johnson W, Kher M. Three new approaches to genomic selection. Plant Breed, 2018, 137: 673-681
doi: 10.1111/pbr.12640 |
| [15] |
Jean M, Cobe E, O’Donoughue L, Rajcan I, Belzile F. Improvement of key agronomical traits in soybean through genomic prediction of superior crosses. Crop Sci, 2021, 61: 3908-3918.
doi: 10.1002/csc2.20583 |
| [16] | Eberhart S A. Factors affecting efficiencies of breeding methods. Afr Soils, 1970, 15: 655-680. |
| [17] |
Cobb J N, Juma R U, Biswas P S, Arbelaez J D, Rutkoski J, Atlin G, Hagen T, Quinn M, Ng E H. Enhancing the rate of genetic gain in public-sector plant breeding programs: lessons from the breeder’s equation. Theor Appl Genet, 2019, 132: 627-645.
doi: 10.1007/s00122-019-03317-0 |
| [18] | Zhou J, Nguyen H T. Solve the Breeder’s Equation using High- throughput Crop Phenotyping Technology. In: High-Throughput Crop Phenotyping (1-11). Wageningen, the Netherlands: Springer, 2021. |
| [19] | Comstock R E, Moll R H. Genotype-environment interactions. Stat Gen Plant Breed, 1963, 982: 164-196. |
| [20] | DeLacy I H, Basford K E, Cooper M, Bull J K, McLaren C G. Analysis of multienvironment trials—a historical perspective. In: Cooper M, Hammer G L, eds. Plant Adaptation and Crop Improvement. Wallingford (UK): IRRI/CABI, 1996. p 39124. |
| [21] |
Atlin G N, Baker R J, McRae K B, Lu X. Selection response in subdivided target regions. Crop Sci, 2000, 40: 7-13.
doi: 10.2135/cropsci2000.4017 |
| [22] | Yan W. Analysis and handling of G×E in a practical breeding program. Crop Sci, 2016, 2106-2118. |
| [23] |
Cooper M, Voss-Fels K P, Messina C D, Tang T, Hammer G L. Tackling G×E×M interactions to close on-farm yield-gaps: creating novel pathways for crop improvement by predicting contributions of genetics and management to crop productivity. Theor Appl Genet, 2021, 134: 1625-1644.
doi: 10.1007/s00122-021-03812-3 pmid: 33738512 |
| [24] | Fehr W. Principles of Cultivar Development:Theory and Technique. New York, USA: Macmillian Publishing Company, 1991. |
| [25] |
Yan W, Hunt L A, Sheng Q, Szlavnics Z. Cultivar evaluation and megaenvironment investigation based on the GGE biplot. Crop Sci, 2000, 40: 597-605.
doi: 10.2135/cropsci2000.403597x |
| [26] |
严威凯. 双标图分析在农作物品种多点试验中的应用. 作物学报, 2010, 36: 1805-1819.
doi: 10.3724/SP.J.1006.2010.01805 |
| Yan W. Optimal use of biplots in analysis of multi-location variety test data. Acta Agron Sin, 2010, 36: 1805-1819 (in Chinese with English Abstract). | |
| [27] | Atlin G N, Kleinknecht K, Singh K P, Piepho H P. Managing genotype × environment interaction in plant breeding programs: a selection theory approach. J Ind Soc Agric Stat, 2011, 65: 237-247. |
| [28] | Yan W. Crop Variety Trials:Data Management and Analysis. New York: John Wiley & Sons, 2014. |
| [29] | Yan W. Mega-environment analysis and test location evaluation based on unbalanced multiyear data. Crop Sci, 2015, 113-122. |
| [30] |
Yan W. LG biplot: a graphical method for mega-environment investigation using existing crop variety trial data. Sci Rep, 2019, 9: 7130.
doi: 10.1038/s41598-019-43683-9 |
| [31] |
Gabriel K R. The biplot graphic display of matrices with application to principal component analysis. Biometrika, 1971, 58: 453-467.
doi: 10.1093/biomet/58.3.453 |
| [32] | Yan W, Mitchell-Fetch J, Beattie A, Nilsen K T, Pageau D, DeHaan B, Hayes M, Mountain N, Cummiskey A, MacEachern D. Oat mega-environments in Canada. Crop Sci, 2021, 61: 1143-1153. |
| [33] | Yan W, Frégeau-Reid J, Martin R, Pageau D, Mitchell-Fetch J. How many test locations and replications are needed in crop variety trials for a target region? Euphytica, 2015, 361-372. |
| [34] | Yan W. Estimation of the optimal number of replicates in crop variety trials. Front Plant Sci, 2021, 11: 2231 |
| [35] |
Becker H C. Correlations among some statistical measures of phenotypic stability. Euphytica, 1981, 30: 835-840.
doi: 10.1007/BF00038812 |
| [36] |
Lin C S, Binns M R, Lefkovitch L P. Stability analysis: where do we stand? Crop Sci, 1986, 26: 894-900.
doi: 10.2135/cropsci1986.0011183X002600050012x |
| [37] |
Huehn M. Nonparametric measures of phenotypic stability. Part 2: applications. Euphytica, 1990, 47: 195-201.
doi: 10.1007/BF00024242 |
| [38] |
Segherloo A E, Sabaghpour S H, Dehghani H, Kamrani M. Non-parametric measures of phenotypic stability in chickpea genotypes (Cicer arietinum L.). Euphytica, 2008, 162: 221-229.
doi: 10.1007/s10681-007-9552-x |
| [39] |
Scapim C A, Pacheco C A P, do Amaral Jr A T, Vieira R A, Pinto R J B, Conrado T V. Correlations between the stability and adaptability statistics of popcorn cultivars. Euphytica, 2010, 174: 209-218.
doi: 10.1007/s10681-010-0118-y |
| [40] |
Eberhart S T, Russell W A. Stability parameters for comparing varieties. Crop Sci, 1966, 6: 36-40.
doi: 10.2135/cropsci1966.0011183X000600010011x |
| [41] |
Ceccarelli S. Wide adaptation: how wide? Euphytica, 1989, 40: 197-205.
doi: 10.1007/BF00024512 |
| [42] |
Zobel R W, Wright M J, Gauch Jr H G. Statistical analysis of a yield trial. Agron J, 1988, 80: 388-393.
doi: 10.2134/agronj1988.00021962008000030002x |
| [43] |
Yan W, Kang M S, Ma B, Woods S, Cornelius P L. GGE biplot vs. AMMI analysis of genotype-by-environment data. Crop Sci, 2007, 47: 643-653.
doi: 10.2135/cropsci2006.06.0374 |
| [44] |
Lin C S, Binns M R. A superiority measure of cultivar performance for cultivar × location data. Can J Plant Sci, 1988, 68: 193-198.
doi: 10.4141/cjps88-018 |
| [45] | Lin C S, Binns M R. Concepts and methods for analyzing regional trial data for cultivar and location selection. Plant Breed Rev, 1994, 12: 271-297. |
| [46] |
Kang M S. Simultaneous selection for yield and stability in crop performance trials: consequences for growers. Agron J, 1993, 85: 754-757.
doi: 10.2134/agronj1993.00021962008500030042x |
| [47] |
Gauch Jr H G, Zobel R W. Predictive and postdictive success of statistical analyses of yield trials. Theor Appl Genet, 1988, 76: 1-10.
doi: 10.1007/BF00288824 pmid: 24231975 |
| [48] | Yan W, Kang M S. GGE Biplot Analysis:a Graphical Tool for Breeders, Geneticists, and Agronomists. Boca Raton, USA: CRC Press, 2002. |
| [49] |
Gauch H G Jr. Statistical analysis of yield trials by AMMI and GGE. Crop Sci, 2006, 46: 1488-1500.
doi: 10.2135/cropsci2005.07-0193 |
| [50] |
Gauch H G Jr, Piepho H P, Annicchiarico P. Statistical analysis of yield trials by AMMI and GGE: further considerations. Crop Sci, 2008, 48: 866-889.
doi: 10.2135/cropsci2007.09.0513 |
| [51] | Yan W. GGE biplot vs. AMMI graphs for genotype-by-environment data analysis. J Indian Soc Agri Stat, 2011, 65: 181-193. |
| [52] |
Badu-Apraku B, Oyekunle M, Obeng-Antwi K, Osuman A S, Ado S G, Coulibay N. Performance of extra-early maize cultivars based on GGE biplot and AMMI analysis. J Agric Sci, 2012, 150: 473.
doi: 10.1017/S0021859611000761 |
| [53] | Amira J O, Ojo D K, Ariyo O J, Oduwaye O A, Ayo-Vaughan M A. Relative discriminating powers of GGE and AMMI models in the selection of tropical soybean genotypes. Afr J Crop Sci, 2013, 21: 67-73. |
| [54] |
Hoyos-Villegas V, Wright E M, Kelly J D. GGE biplot analysis of yield associations with root traits in a Mesoamerican bean diversity panel. Crop Sci, 2016, 56: 1081-1094.
doi: 10.2135/cropsci2015.10.0609 |
| [55] |
Oliveira T R A D, Carvalho H W L D, Oliveira G H F, Costa E F N, Gravina G D A, Santos R D D, Carvalho J L S D. Hybrid maize selection through GGE biplot analysis. Bragantia, 2019, 78: 166-174.
doi: 10.1590/1678-4499.20170438 |
| [56] |
Heslot N, Yang H P, Sorrells M E, Jannink J L. Genomic selection in plant breeding: a comparison of models. Crop Sci, 2012, 52, 146-160.
doi: 10.2135/cropsci2011.06.0297 |
| [57] |
Cullis B R, Gleeson A C. Spatial analysis of field experiments: an extension to two dimensions. Biometrics, 1991, 47: 1449-1460.
doi: 10.2307/2532398 |
| [58] |
Cullis B R, Gogel B, Verbyla A, Thompson R. Spatial analysis of multi-environment early generation variety trials. Biometrics, 1998, 54: 1-18.
doi: 10.2307/2533991 |
| [59] |
Gilmour A R, Cullis B R, Verbyla A P. Accounting for natural and extraneous variation in the analysis of field experiments. J Agric Biol Environ Stat, 1997, 2: 269-293.
doi: 10.2307/1400446 |
| [60] | Burgueño J, Cadena A, Crossa J, Banziger M, Gilmour A R, Cullis B. User’s Guide for Spatial Analysis of Field Variety Trials using ASREML. Mexico: CIMMYT, 2000. |
| [61] |
Qiao C G, Basford K E, DeLacy I H, Cooper M. Evaluation of experimental designs and spatial analyses in wheat breeding trials. Theor Appl Genet, 2000, 100: 9-16.
doi: 10.1007/s001220050002 |
| [62] |
Yang R C, Ye T Z, Blade S F, Bandara M. Efficiency of spatial analyses of field pea variety trials. Crop Sci, 2004, 44: 49-55.
doi: 10.2135/cropsci2004.4900 |
| [63] | Tanksley S D. Molecular markers in plant breeding. Plant Mol Biol Rep, 1983, 1: 3-8. |
| [64] | Yan W, Wallace D H. Breeding for negatively associated traits. Plant Breed Rev, 1995, 13: 141-177. |
| [65] |
Asins M J. Present and future of quantitative trait locus analysis in plant breeding. Plant Breed, 2002, 121: 281-291.
doi: 10.1046/j.1439-0523.2002.730285.x |
| [66] |
Cooper M, van Eeuwijk F A, Hammer G L, Podlich D W, Messina C. Modeling QTL for complex traits: detection and context for plant breeding. Curr Opin Plant Biol, 2009, 12: 231-240.
doi: 10.1016/j.pbi.2009.01.006 pmid: 19282235 |
| [67] |
Hao Y, Velu G, Peña R J, Singh S, Singh R P. Genetic loci associated with high grain zinc concentration and pleiotropic effect on kernel weight in wheat (Triticum aestivum L.). Mol Breed, 2014, 34: 1893-1902.
doi: 10.1007/s11032-014-0147-7 |
| [68] |
Crespo-Herrera L A, Velu G, Singh R P. Quantitative trait loci mapping reveals pleiotropic effect for grain iron and zinc concentrations in wheat. Ann Appl Biol, 2016, 169: 27-35.
doi: 10.1111/aab.12276 |
| [69] | Simmonds N, Smartt J. Principles of Crop Improvement, 2nd edn. Oxford, UK: Blackwell Science Ltd. Press, 1999. |
| [70] |
Yan W, Frégeau-Reid J. Breeding line selection based on multiple traits. Crop Sci, 2008, 48: 417-423.
doi: 10.2135/cropsci2007.05.0254 |
| [71] |
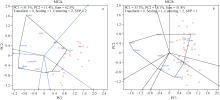
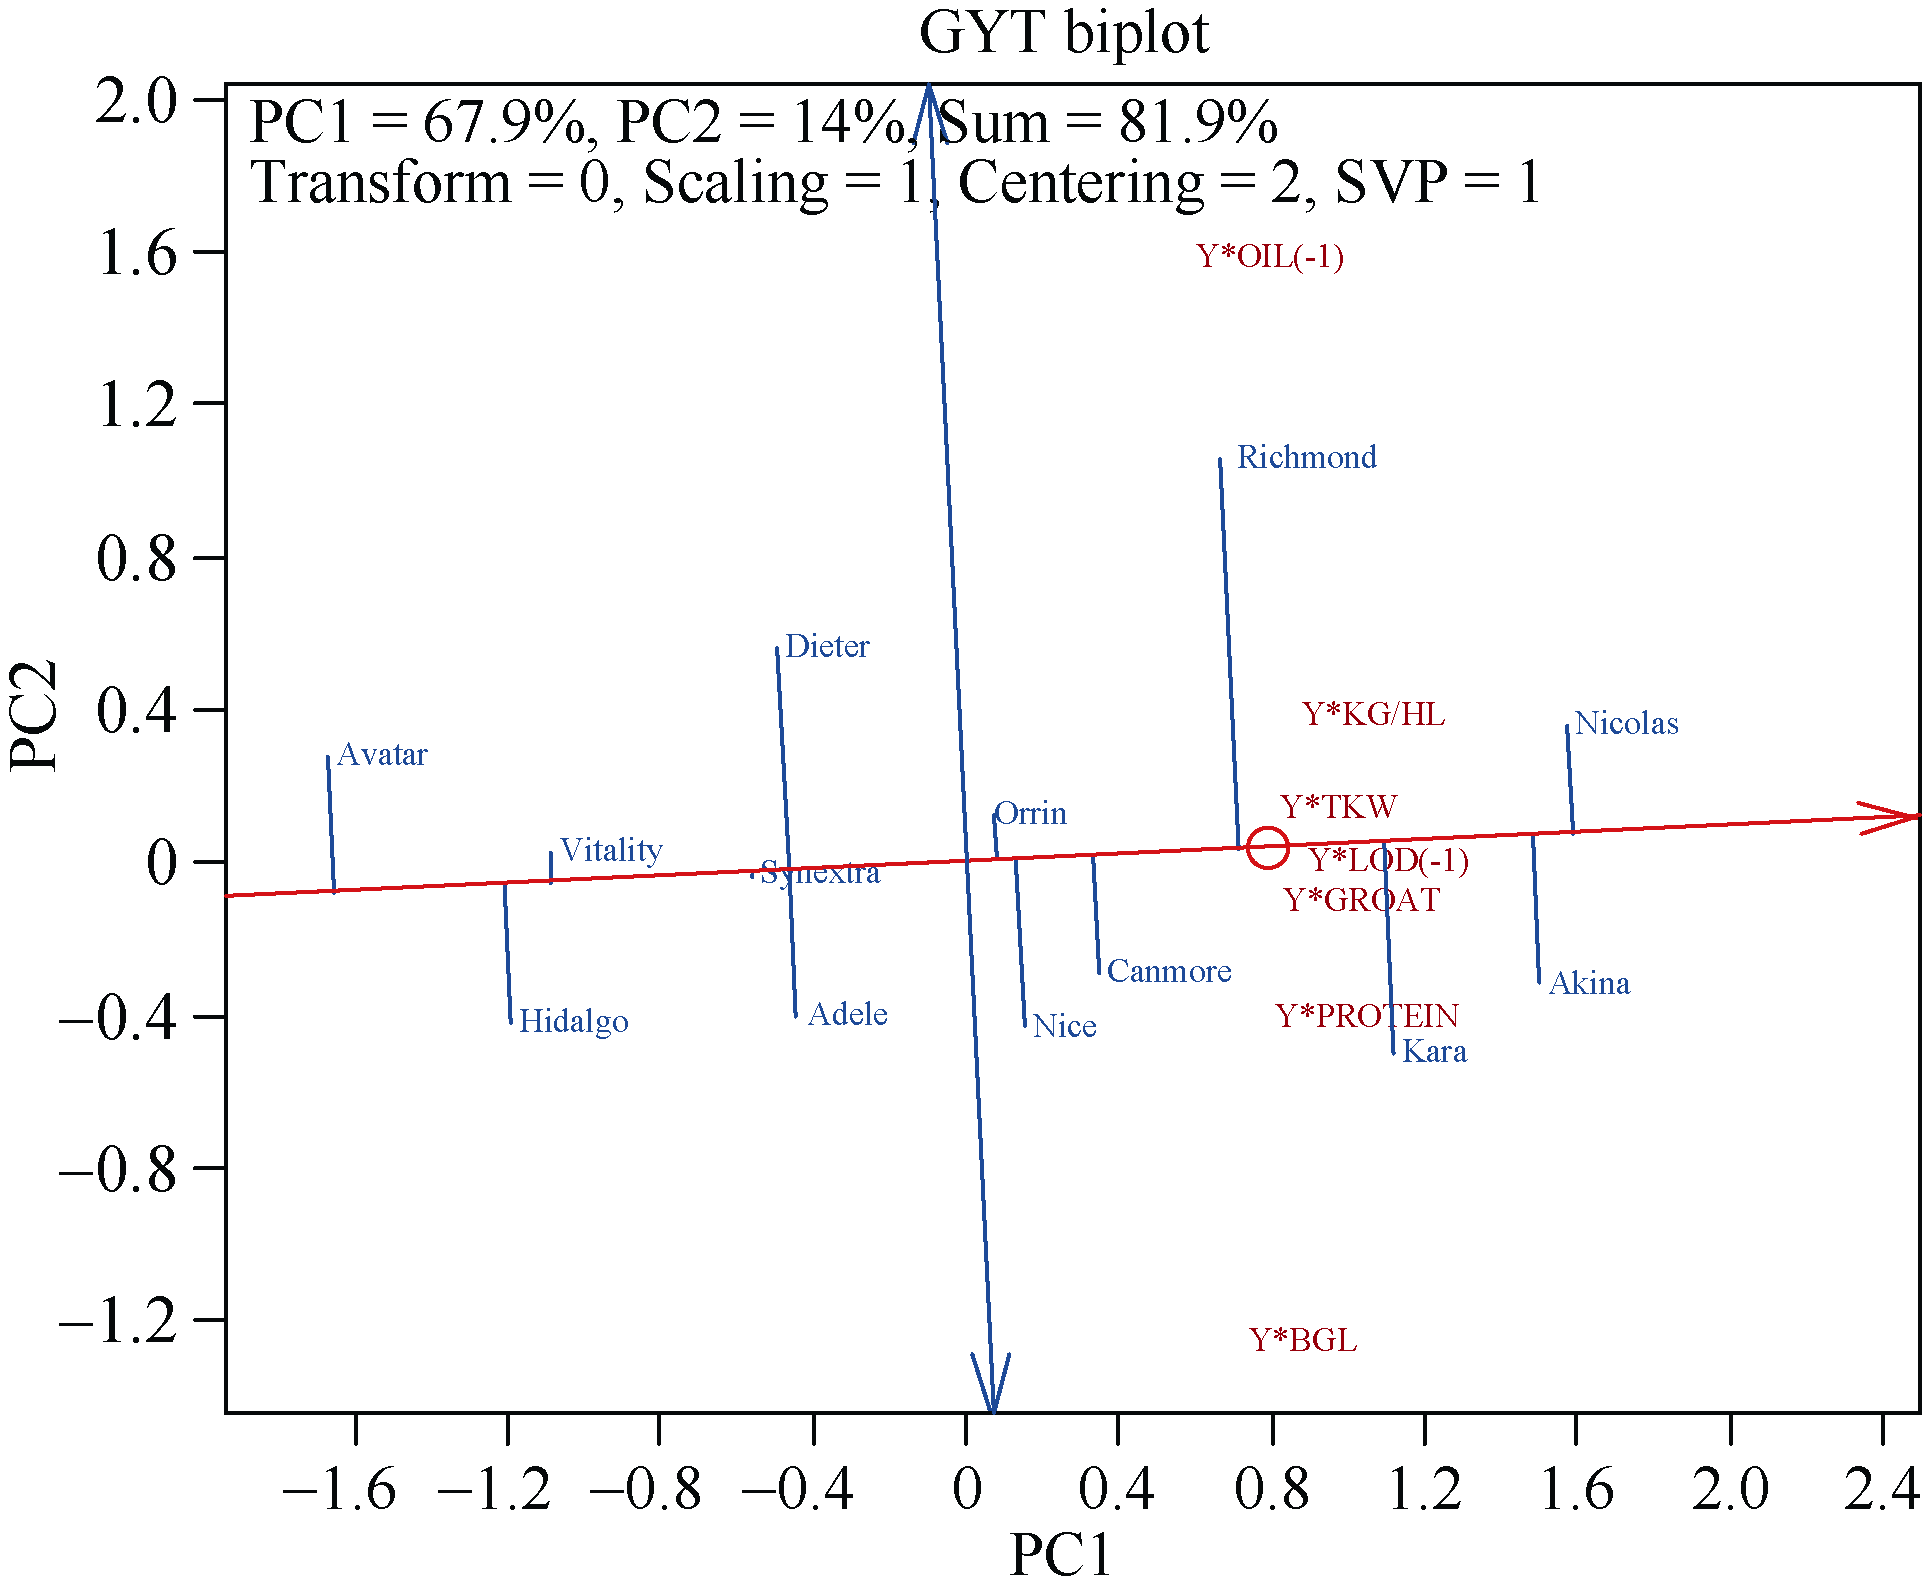
Yan W, Frégeau-Reid J. Genotype by yield×trait (GYT) biplot: a novel approach for genotype selection based on multiple traits. Sci Rep, 2018, 8: 8242.
doi: 10.1038/s41598-018-26688-8 |
| [72] | Yan W, Frégeau-Reid J, Mountain N, Kobler J. Genotype and management evaluation based on genotype by yield × trait (GYT) analysis. Crop Breed Genet Genom, 2019, 1: e190002. |
| [73] | Boureima S, Abdoua Y A O U. Genotype by yield × trait combination biplot approach to evaluate sesame genotypes on multiple traits basis. Turk J Field Crops, 2019, 24: 237-244. |
| [74] | de Oliveira T R A, de Amaral G G, de Moura R M, de Alcântara N F, da Cruz D P, de Oliveira G H F, da Costa J M E P Rocha R S. GYT biplot analysis: a new approach for cowpea line selection. J Exp Agric Internat, 2019, 41: 1-9. |
| [75] |
Mohammadi R. Genotype by yield × trait biplot for genotype evaluation and trait profiles in durum wheat. Cereal Res Commun, 2019, 47: 541-551.
doi: 10.1556/0806.47.2019.32 |
| [76] |
Goddard M E, Hayes B J. Genomic selection. J Anim Breed Genet, 2007, 124: 323-330.
pmid: 18076469 |
| [77] |
Ma F, Xu Y, Ma Z, Li L, An D. Genome-wide association and validation of key loci for yield-related traits in wheat founder parent Xiaoyan 6. Mol Breed, 2018, 38: 91.
doi: 10.1007/s11032-018-0837-7 |
| [78] | Badu-Apraku B, Bankole F A, Ajayo B S, Fakorede M A B, Akinwale R O, Talabi A O. Identification of early and extra-early maturing tropical maize inbred lines resistant to Exserohilum turcicum in sub-Saharan Africa. Crop Prot, 2021, 139: 105386. |
| [79] |
许乃银, 赵素琴, 张芳, 付小琼, 杨晓妮, 乔银桃, 孙世贤. 基于GYT双标图对西北内陆棉区国审棉花品种的分类评价. 作物学报, 2021, 47: 660-671.
doi: 10.3724/SP.J.1006.2021.04135 |
|
Xu N Y, Zhao S Q, Zhang F, Fu X Q, Yang X N, Qiao Y T, Sun S X. Retrospective evaluation of cotton varieties nationally registered for the Northwest Inland cotton growing regions based on GYT biplot analysis. Acta Agron Sin, 2021, 47: 660-671. (in Chinese with English abstract)
doi: 10.3724/SP.J.1006.2021.04135 |
|
| [80] |
Tsenov N, Gubatov T, Yanchev I. Genotype selection for grain yield and quality based on multiple traits of common wheat (Triticum aestivum L.). Cereal Res Commun, 2021, 49: 119-124.
doi: 10.1007/s42976-020-00080-7 |
| [81] |
Sofi P A, Saba I, Ara A, Rehman K. Comparative efficiency of GY × T approach over GT approach in genotypic selection in multiple trait evaluations: case study of common bean (Phaseolus vulgaris) grown under temperate Himalayan conditions. Agric Res (India: Online), 2021, 10.1007/s40003-021-00577-5.
doi: 10.1007/s40003-021-00577-5 |
| [82] |
de Oliveira L A, da Silva C P, da Silva A Q, Mendes C T E, Nuvunga J J, Nunes J A R, Parrella R A D C, Baleste M, Filho J S D S B. Bayesian GGE model for heteroscedastic multi- environmental trials. Crop Sci, 2022, 62: in press. 10.1002/csc2.20696.
doi: 10.1002/csc2.20696 |
| [1] | ZHANG Yi,XU Nai-Yin,GUO Li-Lei,YANG Zi-Guang,ZHANG Xiao-Qing,YANG Xiao-Ni. Optimization of test location number and replicate frequency in regional winter wheat variety trials in northern winter wheat region in China [J]. Acta Agronomica Sinica, 2020, 46(8): 1166-1173. |
| [2] | Lan-Fen WANG, Jing WU, Zhao-Li WANG, Ji-Bao CHEN, Li YU, Qiang WANG, Shu-Min WANG. Adaptability and Phenotypic Variations of Agronomic Traits in Common Bean Germplasm Resources in Different Environments [J]. Acta Agronomica Sinica, 2018, 44(03): 357-368. |
| [3] | MA Yan-Song, LIU Zhang-Xiong, WEN Zi-Xiang, WEI Shu-Hong, YANG Chun-Ming, WANG Hui-Cai6, YANG Chun-Yan, LU Wei-Guo, XU Ran, ZHANG Wan-Hai, WU Ji-An, HU Guo-Hua, LUAN Xiao-Yan, FU . Effect of Population Structure on Prediction Accuracy of Soybean 100-Seed Weight by Genomic Selection MA Yan-Song1,2,13, LIU Zhang-Xiong1, WEN Zi-Xiang3, WEI Shu-Hong4, YANG Chun-Ming5, WANG Hui-Cai6, YANG [J]. Acta Agron Sin, 2018, 44(01): 43-52. |
| [4] | XU Nai-Yin,JIN Shi-Qiao,LI Jian. Design of Test Location Number and Replicate Frequency in the Regional Cotton Variety Trials in China [J]. Acta Agron Sin, 2016, 42(01): 43-50. |
| [5] | LUO Jun,XU Li-Ping,QIU Jun,ZHANG Hua,YUAN Zhao-Nian,DENG Zu-Hu,CHEN Ru-Kai,QUE You-Xiong. Evaluation of Sugarcane Test Environments and Ecological Zone Division in China Based on HA-GGE Biplo [J]. Acta Agron Sin, 2015, 41(02): 214-227. |
| [6] | LUO Jun,ZHANG Hua,DENG Zu-Hu,XU Li-Ping,XU Liang-Nian,YUAN Zhao-Nian,QUE You-Xiong. Analysis of Yield and Quality Traits in Sugarcane Varieties (Lines) with GGE-Biplot [J]. Acta Agron Sin, 2013, 39(01): 142-152. |
| [7] | XU Nai-Yin,ZHANG Guo-Wei,LI Jian,ZHOU Zhi-Guo. Evaluation of Cotton Regional Trial Environments Based on HA-GGE Biplot in the Yangtze River Valley [J]. Acta Agron Sin, 2012, 38(12): 2229-2236. |
| [8] | SHU Yong-Dun, TUN Lei, WANG Dan, GUO Chang-Gong. Application of Artificial Neural Network in Genomic Selection for Crop Improvement [J]. Acta Agron Sin, 2011, 37(12): 2179-2186. |
| [9] | CHEN Guo-Lin,WU Jian-Guo,ZHANG Li,SHI Chun-Hai. Genetic Analysis for Lysine Content of Rapeseed Cake (Brassic napus L.) at Different Periods after Anthesis [J]. Acta Agron Sin, 2010, 36(4): 680-687. |
| [10] | YAN Wei-Kai. Optimal Use of Biplots in Analysis of Multi-Location Variety Test Data [J]. Acta Agron Sin, 2010, 36(11): 1805-1819. |
| [11] | NI Xiao-Wen;YAN Jun;CHEN Xin-Min;XIA Xian-Chun;HE Zhong-Hu;ZHANG Yong;WANG De-Sen;Morten Lillemo. Heritability and Number of Genes Controlling Slow-Mildewing Resis-tance in Wheat Cultivar Lumai 21 [J]. Acta Agron Sin, 2008, 34(08): 1317-1322. |
| [12] | WANG Rui;XU Xing-Fu;LI Jia-Na;TANG Zhang-Lin;CHEN Li. Analysis of Embryo, Cytoplasmic and Maternal Effects on Glucosinolate Components in Brassica napus L. [J]. Acta Agron Sin, 2007, 33(12): 2001-2006. |
| [13] | PEI Zi-You;JIA Gao-Feng;QI Zeng-Jun; ZHUANG Li-Fang; FENG Yi-Gao;WANG Xiu-E;CHEN Pei-Du;LIU Da-Jun. Analyses of Combining Ability of DON Content in Wheat Grains [J]. Acta Agron Sin, 2007, 33(05): 731-737. |
| [14] | NING Hai-Long;LI Wen-Xia;LI Wen-Bin. Analysis of Embryo, Cytoplasmic and Maternal Effects on Fatty Acid Components in Soybean(G. max Merill) [J]. Acta Agron Sin, 2006, 32(12): 1873-1877. |
| [15] | ZHANG Yong;ZHANG Li-Ping;YAN Jun ;ZHANG Yan;WANG De-Sen;LIU Jian-Jun;HE Zhong-Hu. Early Generation Selection of Gluten Strength in Common Wheat [J]. Acta Agron Sin, 2006, 32(11): 1663-1670. |
|
||