Welcome to Acta Agronomica Sinica,

Acta Agronomica Sinica ›› 2021, Vol. 47 ›› Issue (4): 660-671.doi: 10.3724/SP.J.1006.2021.04135

• CROP GENETICS & BREEDING·GERMPLASM RESOURCES·MOLECULAR GENETICS • Previous Articles     Next Articles

Retrospective evaluation of cotton varieties nationally registered for the Northwest Inland cotton growing regions based on GYT biplot analysis

XU Nai-Yin1(), ZHAO Su-Qin2, ZHANG Fang3, FU Xiao-Qiong4, YANG Xiao-Ni1, QIAO Yin-Tao1,5, SUN Shi-Xian3   

  1. 1Institute of Industrial Crops, Jiangsu Academy of Agricultural Sciences / Key Laboratory of Cotton and Rapeseed, Ministry of Agriculture and Rural Affairs, Nanjing 210014, Jiangsu, China
    2Xinjiang Uygur Autonomous Region Seed Industry Development Center, Urumqi 830006, Xinjiang, China
    3National Extension and Service Center of Agricultural Technology, Beijing 100125, China
    4Institute of Cotton Research, Chinese Academy of Agricultural Sciences, Anyang 455000, Henan, China
    5School of Agricultural Engineering, Jiangsu University, Zhenjiang 212013, Jiangsu, China
  • Received:2020-06-22 Accepted:2020-10-14 Online:2021-04-12 Published:2020-11-02
  • Supported by:
    National Agricultural Technology Field Experiment, Demonstration and Service Support (Variety Test) Project(012022911108)

Abstract:

The Northwest inland cotton growing regions (NICR) is currently the most important cotton producing area in China. The scientific classification and comprehensive evaluation of national cotton varieties over the years in this cotton area is beneficial to the rational utilization of national cotton varieties resources and the improvement of cotton production efficiency. According to the national registration bulletins of cotton cultivars, up to 37 cotton cultivars in this region were registered in the national level from 2003 to 2019. These cultivars were evaluated and classified using genotype by yield-trait (GYT) biplot analysis based on their levels in combine with lint cotton yield and other important characteristics including pre-frost yielding rate (PFR), fiber length, fiber strength, micronaire, fusarirum wilt index (FWI), and verticillium wilt index (VWI). Results showed that the 37 cotton cultivars can be clustered into three types with distinct trait profiles. Type I consisted of 17 cotton cultivars, namely Xinluzao 13, Zhongmiansuo 49, Xinluzao 21, Ba 13222, Xin 46, Tianyun 0769, Z1112, Xinshi K18, J206-5, Xinshi K21, Hemian A9-9, Chuangmian 508, H33-1-4, Jinke 20, Xin K28, Chuangmian 512, and J8031, showing high levels of combinations between yield and other target traits, and was the most suitable for cotton production in the region. Type II was characterized by poor performance in FWI, and moderate yielding ability and fiber quality traits, and was of limited application in this area. Type III was characterized by an excellent performance in FWI but poor performance on the other traits, and cultivars of this type may be useful for sources of disease resistance. Cultivars Chuangmian 512, J8031, Xin K28, H33-1-4, Jinke 20, Xinluzao 13, and Chuangmian 508 were selected for their high superiority index, such as high levels of combination between yield and other traits, while Xinlumian 1, Xinluzao 33, Chuangmian 501, and Xinluz 51 were inferior in this context. The GYT biplot analysis in this study differed from traditional index selection in that it was based on the combinatoin level of yield and other traits rather than on the levels of individual traits. In GYT biplot the various yield-trait combinaitons tended to be positievly correlated, allowing for easy visualizationand objective selection of cultivars based on multiple traits. Compared with the more traditional genotype by trait (GT) biplot, GYT biplot normally explained more of the total variation and achieve higher goodness of fit. In addition, the method used in this study could be applied to other regions and crops in this reasearch topic.

Key words: cotton (Gossypium hirsutum L.), cultivar registration, cultivar classification, multiple traits, genotype by trait (GT) biplot, genotype by yield-trait (GYT) biplot, northwest inland cotton growing region (NICR)

Table 1

Key characteristics of 37 cotton cultivars in Northwest inland cotton production region registered from 2003 to 2019"

代码
Code
品种
Cultivar
RY YLD/CK
(%)
PFR
(%)
LEN
(mm)
STR
(cN tex-1)
MIC FWI VWI SI TYPE
G1 新陆早13号 Xinluzao 13 2003 112.9 92.8 31.2 29.7 4.3 47.5 4.6 0.67 I
G2 新陆中20号 Xinluzhong 20 2004 107.4 91.6 30.6 29.5 4.4 3.5 72.0 -0.49 III
G3 中棉所49 Zhongmiansuo 49 2004 110.9 93.7 30.5 29.0 4.3 7.1 31.8 0.36 I
G4 新陆早21号 Xinluzao 21 2005 112.3 90.9 29.6 29.3 4.2 19.0 47.9 0.16 I
G5 新陆棉1号 Xinlumian 1 2006 106.4 88.9 30.3 28.9 4.4 45.2 77.2 -1.17 II
G6 新陆早33号 Xinluzao 33 2007 103.8 88.6 30.2 30.3 4.3 25.9 62.0 -1.03 III
G7 新陆中34号 Xinluzhong 34 2008 104.7 93.9 29.5 31.2 4.2 65.1 38.5 -0.76 II
G8 新陆早49号 Xinluzao 49 2010 107.4 90.2 32.2 32.7 4.6 62.0 76.0 -0.63 II
G9 新陆早51号 Xinluzao 51 2011 104.7 95.7 30.3 30.9 4.5 50.5 70.4 -0.97 II
G10 新陆早48号 Xinluzao 48 2011 114.4 97.7 28.8 28.1 4.3 52.7 51.6 0.08 II
G11 新陆中51号 Xinluzhong 51 2011 110.4 93.8 31.9 32.7 4.3 69.0 66.5 0.05 II
G12 新桑塔6号 Xinsangta 6 2011 110.0 94.3 30.5 30.8 4.3 60.9 78.8 -0.40 II
代码
Code
品种
Cultivar
RY YLD/CK
(%)
PFR
(%)
LEN
(mm)
STR
(cN tex-1)
MIC FWI VWI SI TYPE
G13 新陆中60号 Xinluzhong 60 2012 101.2 91.9 30.3 33.2 4.3 3.6 51.2 -0.71 III
G14 K07-12 2013 106.4 94.0 29.7 30.4 4.3 1.1 65.3 -0.42 III
G15 巴13222 Ba 13222 2013 111.8 93.7 30.3 30.8 4.8 10.4 58.5 0.05 I
G16 万氏472 Wanshi 472 2014 97.0 93.0 33.8 32.1 3.9 0.7 61.9 -0.83 III
G17 新46 Xin 46 2014 116.4 87.5 30.2 28.5 4.8 0.2 50.6 0.27 I
G18 天云0769 Tianyun 0769 2015 111.9 91.5 30.4 30.2 4.2 7.6 55.3 0.35 I
G19 DJ09520 2015 107.7 93.5 31.0 30.9 4.5 3.4 53.2 -0.09 III
G20 创棉50号 Chuangmian 50 2015 109.0 92.6 29.0 30.0 4.9 5.2 54.4 -0.57 III
G21 Z1112 2016 109.6 93.9 29.9 31.6 3.9 5.1 55.1 0.37 I
G22 新石K18 Xinshi K18 2016 107.1 97.7 30.5 29.9 4.0 5.2 64.6 0.01 I
G23 J206-5 2016 112.4 94.8 30.5 30.2 4.1 12.0 61.9 0.52 I
G24 创棉501号 Chuangmian 501 2016 105.8 93.0 29.2 29.5 4.7 10.3 64.7 -0.98 III
G25 惠远720 Huiyuan 720 2017 105.6 97.4 31.4 29.4 4.4 1.5 39.7 -0.13 III
G26 新石K21 Xinshi K21 2017 109.7 98.5 29.8 30.1 4.2 3.8 47.6 0.35 I
G27 禾棉A9-9 Hemian A9-9 2017 108.2 93.6 30.7 30.2 4.2 9.9 19.0 0.31 I
G28 创棉508 Chuangmian 508 2018 110.4 97.2 30.4 31.9 4.4 3.0 43.2 0.57 I
G29 庄稼汉902 Zhuangjiahan 902 2019 105.1 95.8 29.8 31.6 4.4 6.3 33.7 -0.21 III
G30 F015-5 2019 106.6 97.0 30.8 35.4 4.9 3.6 24.0 0.33 III
G31 H33-1-4 2019 110.9 94.9 31.3 32.4 4.3 4.2 33.4 0.86 I
G32 金科20 Jinke 20 2019 110.0 94.1 32.4 33.1 4.3 12.5 34.3 0.85 I
G33 惠远1401 Huiyuan 1401 2019 103.5 96.4 31.0 31.0 4.7 3.6 37.3 -0.49 III
G34 新K28 Xin K28 2019 111.3 95.8 31.1 31.8 4.2 6.7 28.2 0.95 I
G35 中棉201 Zhongmian 201 2019 105.3 94.9 30.8 32.6 4.3 4.5 33.8 0.07 III
G36 创棉512 Chuangmian 512 2019 114.6 97.7 31.1 32.0 4.4 4.2 20.0 1.45 I
G37 J8031 2019 113.4 97.3 31.6 32.6 4.4 7.4 31.5 1.27 I

Fig. 1

Tester vector view of GT biplot (a) and the relation among yield-trait combinations view of GYT biplot (b) of national registered cotton cultivars in Northwest inland cotton planting region in China"

Fig. 2

Average superiority index (a) and variety clustering view of GYT biplot (b) based on the national cotton varieties in Northwest inland cotton region of China The dotted ellipses in Fig. 2-b delineate the varieties which are members of the same cluster at the first three levels in the cluster analysis based on the first two PCs of GYT biplot (the cluster dendrogram was omitted here). I, II, and III stand for the three variety types respectively. Abbreviations are the same as those given in Table 1 and Table 2."

Table 2

Pearson correlations among yield-trait combinations of 37 nationally registered cotton cultivars in the Northwest inland cotton region"

产量×性状组合
Yield×trait combination
Y×PFR Y×LEN Y×STR Y×MIC (~1) Y×FWI (-1) Y×VWI (-1) SI
产量×霜前花率Yield× pre-frost yielding rate (Y×PFR) 1
产量×纤维长度Yield× fiber length (Y×LEN) 0.586** 1
产量×比强度Yield× fiber strength(Y×STR) 0.518** 0.624** 1
产量×马克隆值Yield× micronaire [Y×MIC(~1)] 0.516** 0.471** 0.170 ns 1
产量×枯萎病指数
Yield× fusarirum wilt index [Y×FWI(-1)]
0.136 ns 0.031 ns 0.070 ns -0.043 ns 1
产量×黄萎病指数
Yield× verticillium wilt index[Y×VWI(-1)]
0.458** 0.359* 0.410** 0.191 ns 0.316* 1
品种理想指数Cultivar superiority index (SI) 0.813** 0.776** 0.707** 0.583** 0.382* 0.692** 1

Table 3

Characteristics of different clusters of the nationally registered cotton varieties for the Northwest Inland cotton planting region based on GYT biplot analysis"

产量×性状组合
Yield × trait combination
I型品种
Variety type I
(mean ± SE)
II型品种
Variety type II
(mean ± SE)
III型品种
Variety type III
(mean ± SE)
产量×霜前花率Yield × pre-frost yielding rate (Y×PFR) 0.63±0.15 a -0.16±0.44 b -0.73±0.23 b
产量×纤维长度Yield × fiber length (Y×LEN) 0.66±0.18 a -0.14±0.40 b -0.79±0.17 b
产量×比强度Yield × fiber strength (Y×STR) 0.40±0.21 a -0.15±0.39 ab -0.44±0.28 b
产量×马克隆值Yield × micronaire [Y×MIC(~1)] 0.69±0.16 a -0.03±0.31 b -0.89±0.20 c
产量×枯萎病指数 Yield × fusarirum wilt index [Y×FWI(-1)] 0.43±0.12 a -1.86±0.15 b 0.45±0.08 a
产量×黄萎病指数Yield × verticillium wilt index [Y×VWI(-1)] 0.50±0.23 a -0.92±0.30 b -0.15±0.22 ab
品种理想指数 Cultivar superiority index (SI) 0.55±0.10 a -0.54±0.18 b -0.43±0.11 b

Table S1

Genotype by yieldxtrait (GYT) data, the standardized GYT data and superiority index (SI) for 37 cotton cultivars nationally registered in the Northernwest cotton producing region during 2003-2019"

[1] Yan W K, Frégeau-Reid J. Breeding line selection based on multiple traits. Crop Sci, 2008,48:417-423.
doi: 10.2135/cropsci2007.05.0254
[2] 
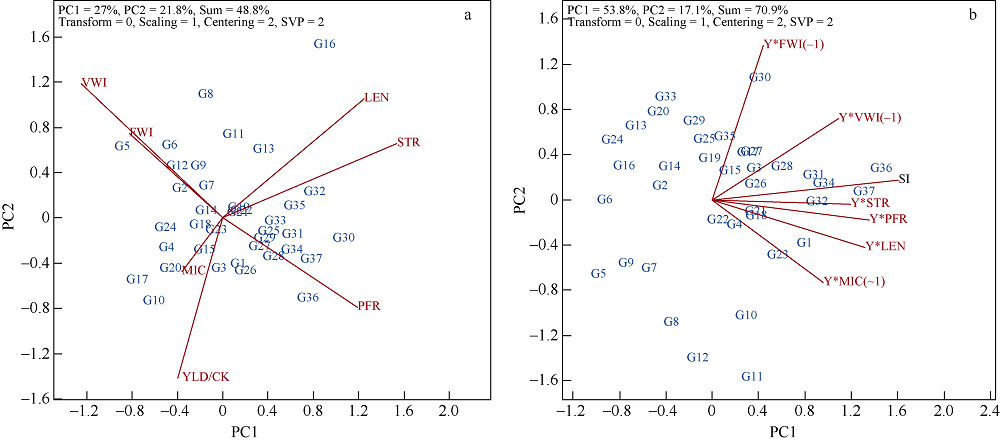
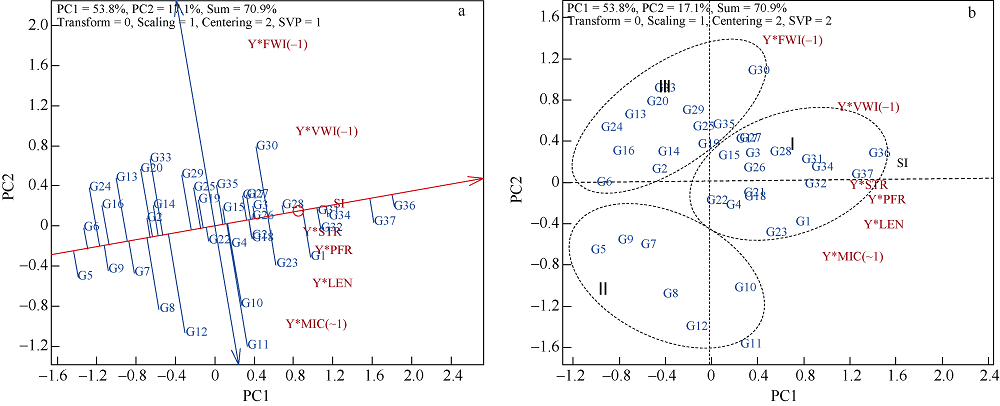
Yan W K, Frégeau-Reid J. Genotype by yield*trait (GYT) biplot: a novel approach for genotype selection based on multiple traits. Sci Rep, 2018,8:8242.
doi: 10.1038/s41598-018-26688-8 pmid: 29844453
[3] Cooper M, Woodruff D R, Eisemann R L, Brennan P S, Delacy I H. A selection strategy to accommodate genotype-by-environment interaction for grain yield of wheat: managed-environments for selection among genotypes. Theor Appl Genet, 1995,90:492-502.
doi: 10.1007/BF00221995 pmid: 24173943
[4] 许乃银, 李健. 棉花区试中品种多性状选择的理想试验环境鉴别. 作物学报, 2014,40:1936-1945.
doi: 10.3724/SP.J.1006.2014.01936
Xu N Y, Li J. Identification of ideal test environments for multiple traits selection in cotton regional trials. Acta Agron Sin, 2014,40:1936-1945 (in Chinese with English abstract).
[5] 许乃银, 李健. 基于GGE双标图的长江流域国审棉花品种分类特征评价. 中国农业科学, 2014,47:4780-4789.
doi: 10.3864/j.issn.0578-1752.2014.24.002
Xu N Y, Li J. Evaluation on the classification characteristics of national registered cotton varieties in the Yangtze River Valley based on GGE biplot. Sci Agric Sin, 2014,47:4780-4789 (in Chinese with English abstract).
[6] Yan W K. Crop Variety Trials: Data Management and Analysis. Oxford: Wiley-Blackwell, 2014. pp 163-186.
[7] 许乃银, 李健. 我国主产棉区棉花纤维品质性状的区域分布特征. 中国生态农业学报, 2016,24:1547-1554.
Xu N Y, Li J. Regional distribution characteristics of cotton fiber quality in main cotton production areas in China. Chin J Eco- Agric, 2016,24:1547-1554 (in Chinese with English abstract).
[8] Xu N Y, Fok M, Zhang G W, Li J, Zhou Z G. The application of GGE biplot analysis for evaluating test locations and mega- environment investigation of cotton regional trials. J Integr Agric, 2014,13:1921-1933.
doi: 10.1016/S2095-3119(13)60656-5
[9] Merrick L F, Glover K D, Yabwalo D, Byamukama E. Use of genotype by yield*trait (GYT) analysis to select hard red spring wheat with elevated performance for agronomic and disease resistance traits. Crop Breed Genet Genom, 2020,2:e200009.
[10] Yan W K, Frégeau-Reid J, Mountain N, Kobler J. Genotype and management evaluation based on genotype by yield*trait (GYT) analysis. Crop Breed Genet Genom, 2019,1:e190002.
[11] Yan W K, Holland J B. A heritability-adjusted GGE biplot for test environment evaluation. Euphytica, 2010,171:355-369.
doi: 10.1007/s10681-009-0030-5
[12] 严威凯. 双标图分析在农作物品种多点试验中的应用. 作物学报, 2010,36:1805-1819.
doi: 10.3724/SP.J.1006.2010.01805
Yan W K. Optimal use of biplots in analysis of multi-location variety test data. Acta Agron Sin, 2010,36:1805-1819 (in Chinese with English abstract).
[13] Yan W K, Kang M S, Ma B L, Woods S, Cornelius P L. GGE biplot vs. AMMI analysis of genotype-by-environment data. Crop Sci, 2007,47:643-655.
doi: 10.2135/cropsci2006.06.0374
[14] Yan W K. Singular-value partioning in biplot analysis of multienvironment trial data. Agron J, 2002,94:990-996.
doi: 10.2134/agronj2002.0990
[15] Xu N Y, Fok M, Li J, Yang X N, Yan W K. Optimization of cotton variety registration criteria aided with a genotype-by-trait biplot analysis. Sci Rep, 2017,7:17237.
doi: 10.1038/s41598-017-17631-4 pmid: 29222523
[16] Adugna W, Labuschagne M T. Cluster and canonical variate analyses in multilocation trials of linseed. J Agric Sci, 2003,140:297-304.
doi: 10.1017/S0021859603003174
[1] ZHAO Wen-Qing, XU Wen-Zheng, YANG Liu-Yan, LIU Yu, ZHOU Zhi-Guo, WANG You-Hua. Different response of cotton leaves to heat stress is closely related to the night starch degradation [J]. Acta Agronomica Sinica, 2021, 47(9): 1680-1689.
[2] Li-Xia QIN, Jing LI, Huan-Yang ZHANG, Sheng LI, Meng-Jie ZHU, Gai-Li JIAO, Shen-Jie WU. Cloning and Expression Analysis of Galactosyltransferase Gene GhGalT1 Promoter in Cotton [J]. Acta Agronomica Sinica, 2018, 44(02): 218-226.
[3] XU Nai-Yin,LI Jian. Identification of Ideal Test Environments for Multiple Traits Selection in Cotton Regional Trials [J]. Acta Agron Sin, 2014, 40(11): 1936-1945.
Viewed
Full text


Abstract

Cited

  Shared   
  Discussed   
No Suggested Reading articles found!