欢迎访问作物学报,今天是
作物学报 ›› 2020, Vol. 46 ›› Issue (02): 290-299.doi: 10.3724/SP.J.1006.2020.93027
付江鹏,贺正,贾彪( ),刘慧芳,李振洲,刘志
FU Jiang-Peng,HE Zheng,JIA Biao(),LIU Hui-Fang,LI Zhen-Zhou,LIU Zhi
摘要:
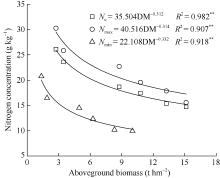
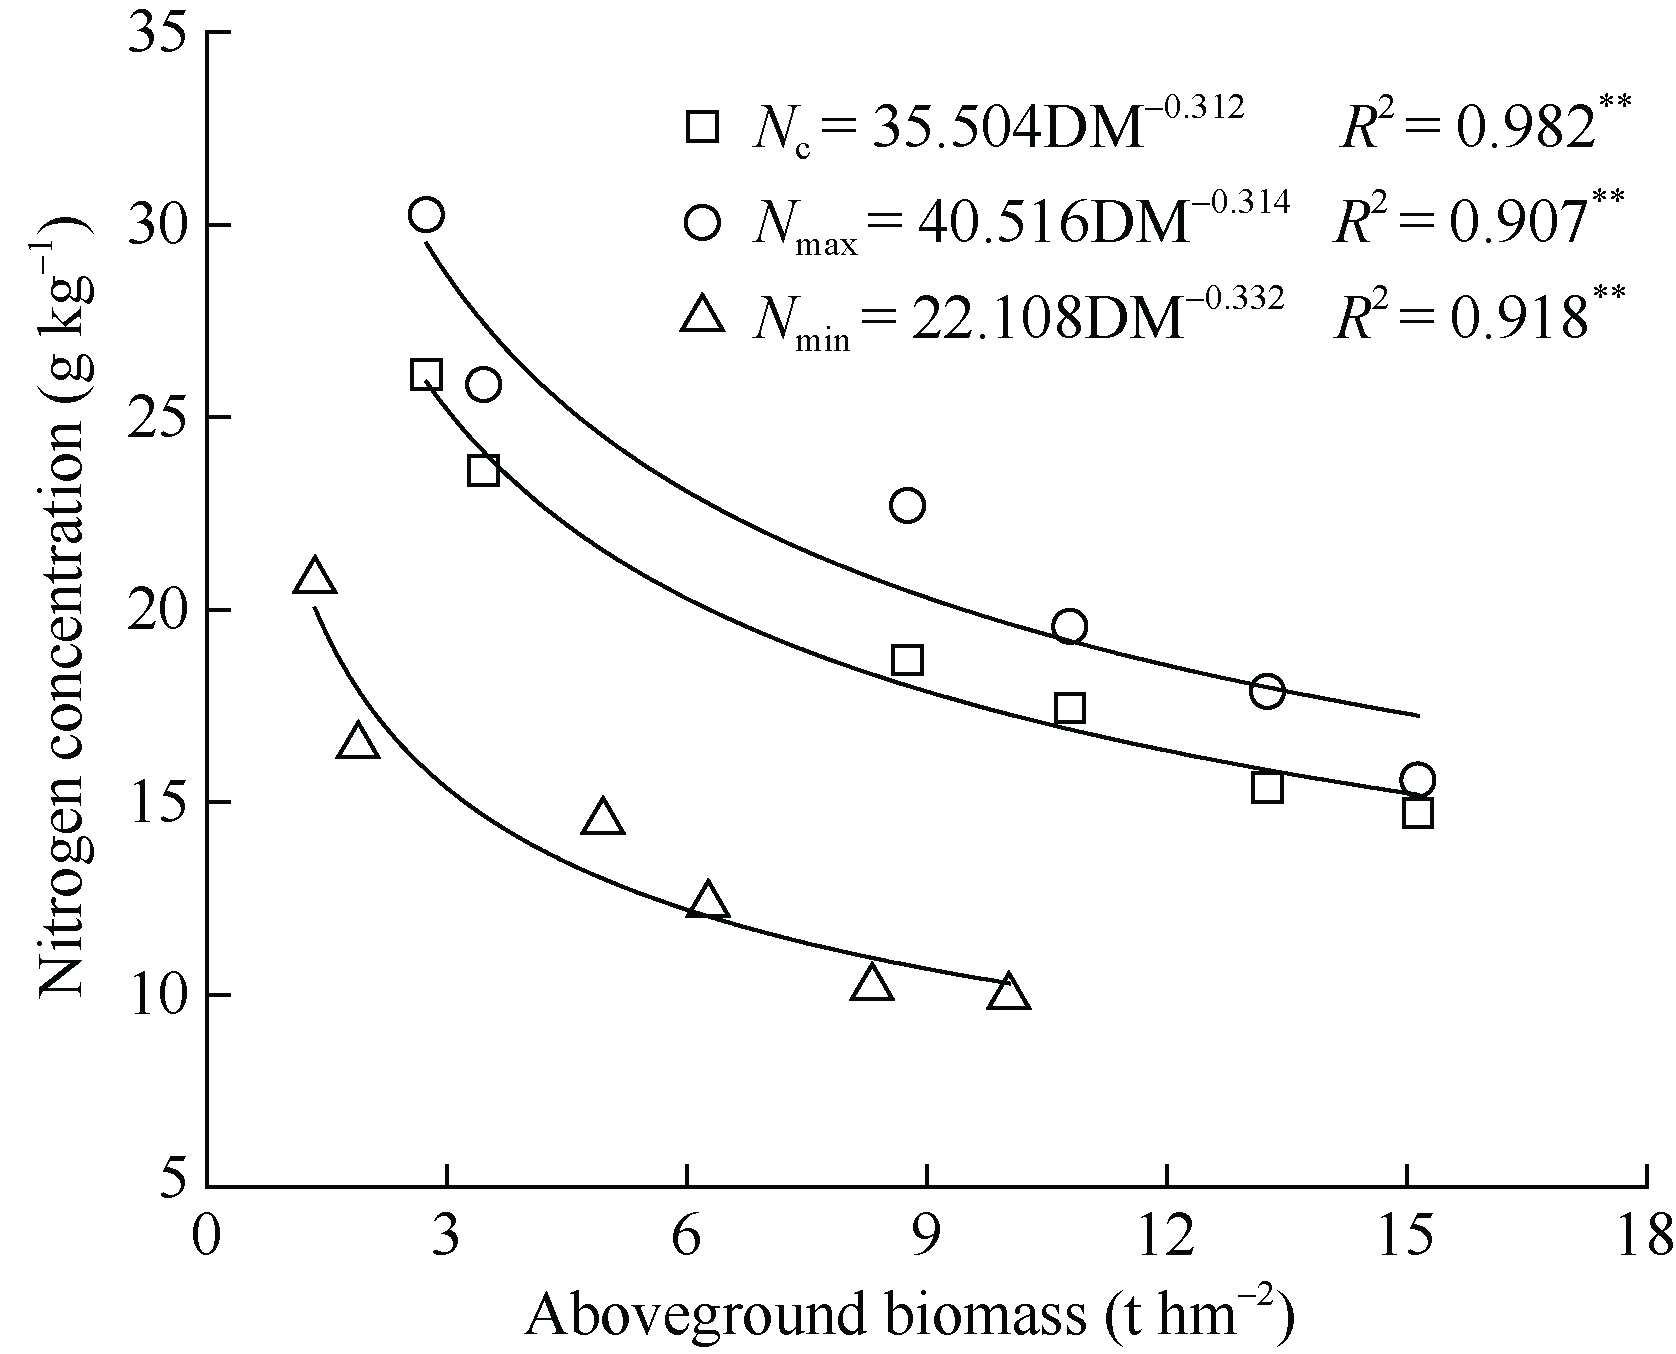
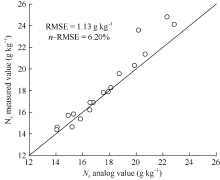
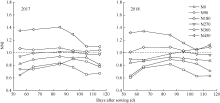
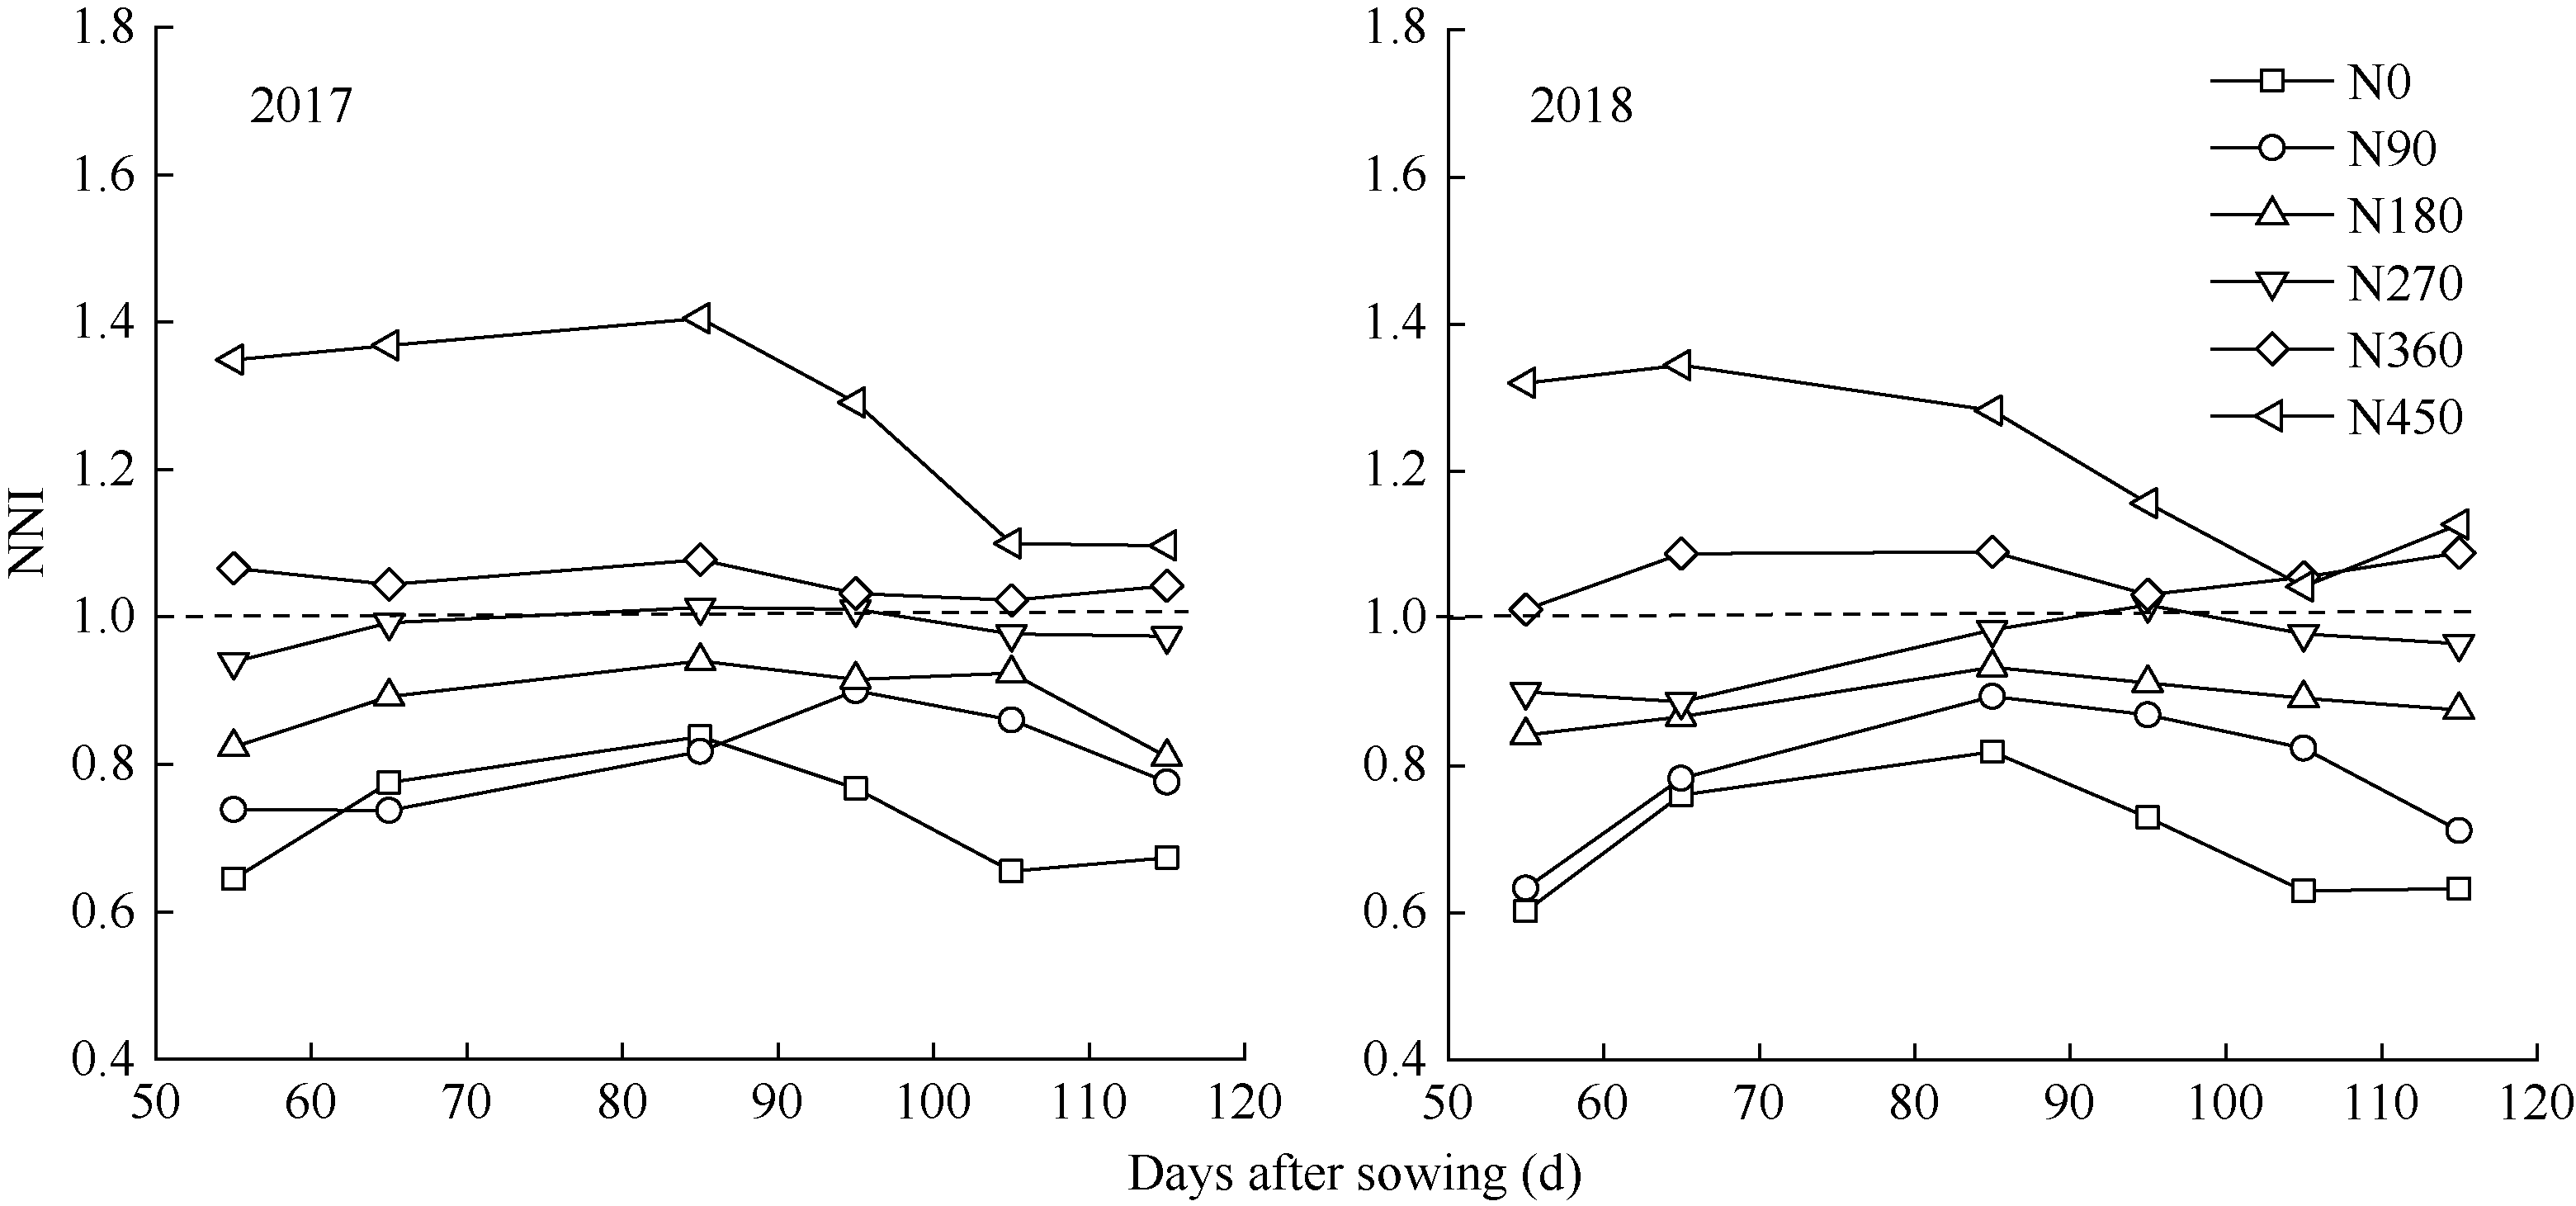
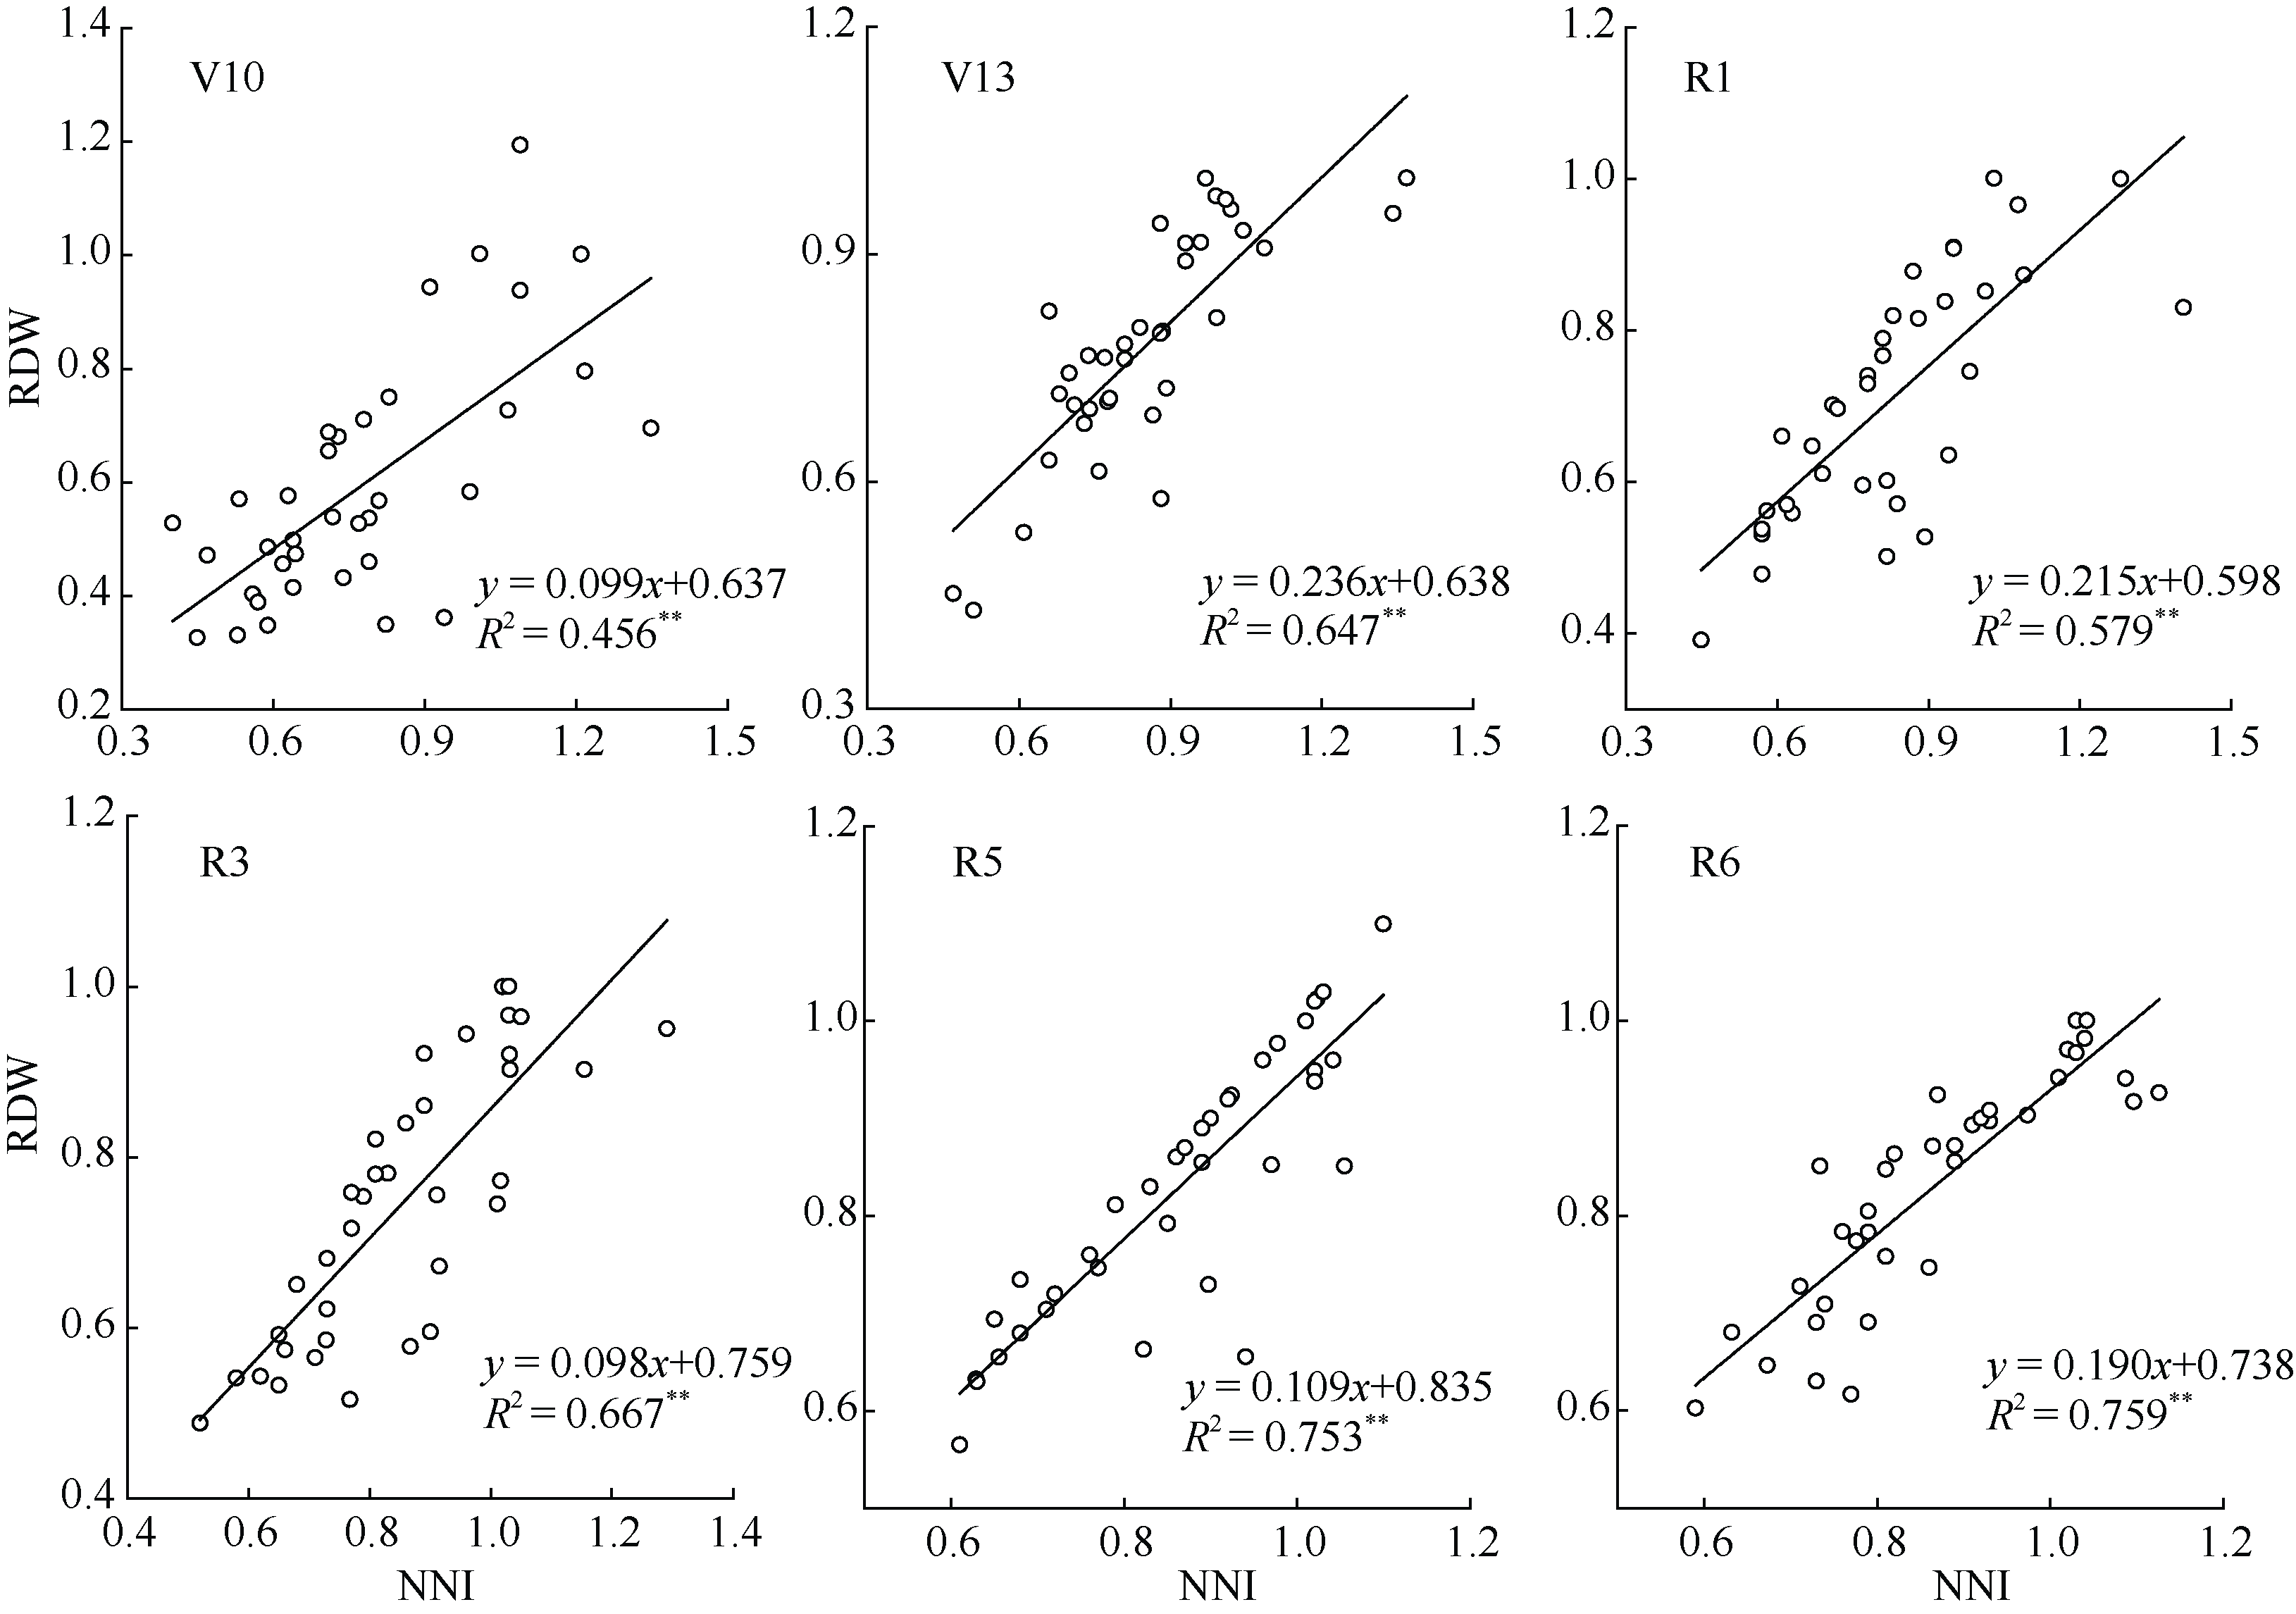
旨在建立宁夏引黄灌区滴灌玉米临界氮稀释曲线模型, 探讨氮营养指数(NNI)用于实时诊断和评价玉米氮素营养状况的可行性, 为实现滴灌玉米合理施用氮肥提供理论依据。以天赐19为试验材料, 采用滴灌水肥一体化技术, 设6个氮肥水平, 利用2年定位试验构建并验证了临界氮稀释曲线模型。结果表明: (1)在一定范围内, 滴灌玉米干物质积累量随施氮水平的提高而增加, 根据方差分析结果, 将玉米各生育时期的地上部生物量分为限氮和非限氮2类; (2)滴灌玉米植株氮浓度均随着施氮量的增加而提高, 但随生育期的推进和地上部干物质量的增加, 玉米植株氮浓度均呈下降趋势; (3)滴灌玉米临界氮浓度(Nc)、最大氮浓度(Nmax)和最小氮浓度(Nmin)稀释模型与地上部干物质累积量之间均呈现幂函数关系, 其决定系数R 2分别为0.982、0.907、0.918, 利用均方根误差(RMSE)和标准化均方根误差(n-RMSE)的验证表明, 该模型稳定性好, 误差范围小; (4)氮素营养指数模型(NNI)可衡量滴灌玉米氮素营养状况, 滴灌水肥一体化条件下, 宁夏引黄灌区玉米以270 kg hm -2为最佳施氮量; (5)根据模型推算, NNI与相对吸氮量(RNupt)、相对地上部生物量(RDW)和相对产量(RY)均极显著相关。本研究所建立的滴灌玉米临界氮稀释曲线模型和氮营养指数模型, 能够精准地预测水肥一体化条件下玉米小喇叭口期至成熟期的氮素营养状况, 为优化玉米的氮素管理提供指导。
| [1] |
Mosisa W, Marianne B, Gunda S, Dennis F, Alpha O D, Walter J H . Nitrogen uptake and utilization in contrasting nitrogen efficient tropical maize hybrids. Crop Sci, 2007,47:519-528.
doi: 10.1371/journal.pone.0199492 pmid: 29949626 |
| [2] |
Judith N, Adrien N D, Martin H C, Marc R L . Variations in corn yield and nitrogen uptake in relation to soil attributes and nitrogen availability indices. Soil Sci Soc Am, 2009,73:317-327.
doi: 10.2136/sssaj2007.0374 |
| [3] |
Guo J H, Liu X J, Zhang Y, Shen J L, Han W X, Zhang W F, Christie P, Goulding K W T, Vitousek P M, Zhang F S . Significant acidification in major Chinese croplands. Science, 2010,327:1008-1010.
doi: 10.1126/science.1182570 pmid: 20150447 |
| [4] |
Ziadi N, Brassard M, Bélanger G, Cambouris A N, Tremblay N N, Michel C, Claessens A, Parent L . Critical nitrogen curve and nitrogen nutrition index for corn in eastern canada. Agron J, 2008,100:271-276.
doi: 10.2134/agronj2007.0059 |
| [5] |
Greenwood D J, Gastal F, Lemaire G . Growth rate and %N of field grown crops: theory and experiments. Ann Bot, 1991,67:181-190.
doi: 10.1093/oxfordjournals.aob.a088118 |
| [6] |
Greenwood D J, Lemaire G, Goss P, Cruz A . Decline in percentage N of C3 and C4 crops with increasing plant mass. Ann Bot, 1990,66:425-436.
doi: 10.1093/oxfordjournals.aob.a088044 |
| [7] | Lemaire G, Gastal F, Cruz P, Greenwood D J, Draycott A. Relationships between plant-N, plant mass and relative growth rate for C3 and C4 crops. In: Scaife A ed. Proceedings of the First European Society of Agronomy Congress, Paris, France, 1990. pp 1-5. |
| [8] | Huang S Y . A new critical nitrogen dilution curve for rice nitrogen status diagnosis in Northeast China. Pedosphere, 2018,28:814-822. |
| [9] | 吕茹洁, 商庆银, 陈乐, 曾勇军, 胡水秀, 杨秀霞 . 水稻基于临界氮浓度的水稻氮素营养诊断研究. 植物营养与肥料学报, 2018,24:1396-1405. |
| Lyu R J, Shang Q Y, Chen L, Zeng Y J, Hu S X, Yang X X . Diagnostic study of nitrogen nutrition in rice based on critical nitrogen concentration. J Plant Nutr Fert, 2018,24:1396-1405 (in Chinese with English abstract). | |
| [10] |
Zia D N, Belanger G, Claessens A . Determination of a critical nitrogen dilution curve for spring wheat. Agron J, 2010,102:241-250.
doi: 10.2134/agronj2009.0266 |
| [11] | 李正鹏, 冯浩, 宋明丹 . 关中平原冬小麦临界氮稀释曲线和氮营养指数研究. 农业机械学报, 2015,46(10):177-183. |
| Li Z P, Feng H, Song M D . Study on critical nitrogen dilution curve and nitrogen nutrition index of winter wheat in Guanzhong Plain. Trans CSAM, 2015,46(10):177-183 (in Chinese with English abstract). | |
| [12] |
Giletto C M, Echeverría H E . Critical nitrogen dilution curve for processing potato in Argentinean humid pampas. Am J Potato Res, 2012,89:102-110.
doi: 10.1007/s12230-011-9226-z |
| [13] | 马露露, 吕新, 张泽, 马革新, 海兴岩 . 基于临界氮浓度的滴灌棉花氮素营养诊断模型研究. 农业机械学报, 2018,49(2):277-283. |
| Ma L L, Lyu X, Zhang Z, Ma G X, Hai X Y . Study on nitrogen nutrition diagnosis model of cotton under drip irrigation based on critical nitrogen concentration. Trans CSAM, 2018,49(2):277-283 (in Chinese with English abstract). | |
| [14] | 石小虎, 蔡焕杰 . 基于叶片SPAD估算不同水氮处理下温室番茄氮营养指数. 农业工程学报, 2018,34(17):124-134. |
| Shi X H, Cai H J . Estimation of nitrogen nutrition index of greenhouse tomato under different water and nitrogen treatment based on leaf SPAD. Trans CSAE, 2018,34(17):124-134 (in Chinese with English abstract). | |
| [15] |
Plénet D, Lemaire G . Relationships between dynamics of nitrogen uptake and dry matter accumulation in maize crops, determination of critical N concentration. Plant Soil, 1999,216:65-82.
doi: 10.1023/A:1004783431055 |
| [16] |
Herrmann A, Taube F . The range of the critical N dilution curve for maize can be extended until silage maturity. Agron J, 2004,96:1131-1138.
doi: 10.2134/agronj2004.1131 |
| [17] |
Ziadi N, Brassard M, Bélanger G, Cambouris A N, Tremblay N, Nolin M C, Claessens A, Parent L E . Critical N curve and N nutrition index for corn in Eastern Canada. Agron J, 2008,100:271-276.
doi: 10.2134/agronj2007.0059 |
| [18] | Yue S C, Sun F L, Meng Q F . Validation of a critical nitrogen curve for summer maize in the north China plain. Pedosphere, 2014,24:76-83. |
| [19] |
梁效贵, 张经廷, 周丽丽, 李旭辉, 周顺利 . 华北地区夏玉米临界氮稀释曲线和氮营养指数研究. 作物学报, 2013,39:292-299.
doi: 10.3724/SP.J.1006.2013.00292 |
|
Liang X G, Zhang J T, Zhou L L, Li X H, Zhou S L . Study on critical nitrogen dilution curve and nitrogen nutrition index of summer maize in north China. Acta Agron Sin, 2013,39:292-299 (in Chinese with English abstract).
doi: 10.3724/SP.J.1006.2013.00292 |
|
| [20] | 李正鹏, 宋明丹, 冯浩 . 关中地区玉米临界氮浓度稀释曲线的建立和验证. 农业工程学报, 2015,31(13):135-141. |
| Li Z P, Song M D, Feng H . Establishment and verification of dilution curve of critical nitrogen concentration in maize in Guanzhong area. Trans CSAE, 2015,31(13):135-141(in Chinese with English abstract). | |
| [21] | 银敏华, 李援农, 谷晓博, 周昌明, 董丽利, 张天乐 . 氮肥运筹对夏玉米氮素盈亏与利用的影响. 农业机械学报, 2015,46(10):167-176. |
| Yin M H, Li Y N, Gu X B, Zhou C M, Dong L L, Zhang T L . Effects of nitrogen fertilizer management on nitrogen profit and loss and utilization of summer maize. Trans CSAM, 2015,46(10):167-176 (in Chinese with English abstract). | |
| [22] | 安志超, 黄玉芳, 汪洋, 赵亚南, 岳松华, 师海斌, 叶优良 . 不同氮效率夏玉米临界氮浓度稀释模型与氮营养诊断. 植物营养与肥料学报, 2019,25:123-133. |
| An Z C, Huang Y F, Wang Y, Zhao Y N, Yue S H, Shi H B, Ye Y L . Dilution model of critical nitrogen concentration and nitrogen nutrition in summer maize with different nitrogen efficiency. J Plant Nutr Fert, 2019,25:123-133 (in Chinese with English abstract). | |
| [23] | 王永宏 . 宁夏玉米栽培. 北京: 中国农业科学技术出版社, 2014. pp 17-19. |
| Wang Y H. Corn Cultivation in Ningxia. Beijing: China Agricultural Science and Technology Press, 2014. pp 17-19(in Chinese). | |
| [24] |
Brye K R, Norman J M, Gower S T . Methodological limitations and N-budget differences among a restored tallgrass prairie and maize agroecosystems. Agric Ecosyst Environ, 2003,97:181-198.
doi: 10.1016/S0167-8809(03)00067-7 |
| [25] |
Allen R G . Using the FAO-56 dual crop coefficient method over an irrigated region as part of an evapotranspiration intercomparison study. J Hydrol, 2000,229:27-41.
doi: 10.1016/S0022-1694(99)00194-8 |
| [26] |
Justes E, Mary B, Meynard J M . Determination of a critical nitrogen dilution curve for winter wheat crops. Ann Bot, 1994,74:397-407.
doi: 10.3389/fpls.2017.01517 pmid: 28928757 |
| [27] |
Willmott C J . Some comments on the evaluation of model performance. Bull Am Meteorol Soc, 1982,63:1309-1369.
doi: 10.1016/j.jsurg.2019.06.012 pmid: 31281109 |
| [28] |
Yang J, Greenwood D J, Rowell D L . Statistical methods for evaluating a crop nitrogen simulation model, N-ABLE. Agric Syst, 2000,64:37-53.
doi: 10.1016/S0308-521X(00)00010-X |
| [29] |
Jamieson P D, Porter J R, Wilson D R . A test of the computer simulation model ARCWHEAT1 on wheat crops grown in New Zealand. Field Crops Res, 1991,27:337-350.
doi: 10.1016/0378-4290(91)90040-3 |
| [30] |
Lemaire G, Onillon B, Onillon G . Nitrogen distribution within a Luceme canopy during regrowth: relation with light distribution. Ann Bot, 1991,68:483-488.
doi: 10.1093/oxfordjournals.aob.a088286 |
| [31] | 赵如浪, 杨滨齐, 王永宏, 赵健, 张文杰, 孙发国, 谢铁娜 . 宁夏高产玉米群体产量构成及生长特性研究. 玉米科学, 2014,22(3):60-66. |
| Zhao R L, Yang B Q, Wang Y H, Zhao J, Zhang W J, Sun F G, Xie T L . Yield structure and growth characteristics of high yield maize population in Ningxia. J Maize Sci, 2014,22(3):60-66 (in Chinese with English abstract). | |
| [32] |
Liu J L, Zhan A, Bu L D, Zhu L, Luo S S, Chen X P, Cui Z L, Li S Q, Hill R L, Zhao Y . Understanding dry matter and nitrogen accumulation for high-yielding film-mulched maize. Agron J, 2014,106:390-396.
doi: 10.2134/agronj2013.0404 |
| [33] | Yue S, Sun F, Meng Q, Zhao R, Li F, Chen X, Zhang F . Validation of a critical nitrogen curve for summer maize in the North China Plain. Pedosphere, 2014,24:76-83. |
| [34] | Lemaire G, Gastal F . Nitrogen Uptake and Distribution in Plant Canopies Diagnosis of the Nitrogen Status in Crops. Heidelberg: Springer-Verlag Publishers, 1997, ( 3):3-43. |
| [35] | 张富仓, 严富来, 范兴科, 李国栋, 刘翔, 陆军胜, 王英, 麻玮青 . 滴灌施肥水平对宁夏春玉米产量和水肥利用效率的影响. 农业工程学报, 2018,34(22):111-120. |
| Zhang F C, Yan F L, Fan X K, Li G D, Liu X, Liu J S, Wang Y, Ma W Q . Effects of irrigation and fertilization levels on grain yield and water-fertilizer use efficiency of drip-fertigation spring maize in Ningxia. Trans CSAE, 2018,34(22):111-120 (in Chinese with English abstract). |
| [1] | 刘恩波, 陈静, 李红星, 于宁宁, 任佰朝, 赵斌, 刘鹏, 张吉旺. 遮阴改变源-库平衡和调节碳水化合物代谢进而抑制夏玉米幼穗发育[J]. 作物学报, 2026, 52(6): 1891-1901. |
| [2] | 梁进宇, 尹嘉德, 王红丽, 张国平, 侯慧芝, 董博, 马明生. 基于无人机高光谱和机器学习的旱地饲用玉米叶片氮含量估测[J]. 作物学报, 2026, 52(6): 1788-1801. |
| [3] | 孙淑凤, 许振南, 黄嘉鑫, 翁建峰, 李新海. 玉米MAPK家族全基因组鉴定及其对拟轮枝镰孢菌感染的响应[J]. 作物学报, 2026, 52(5): 1291-1308. |
| [4] | 张宁宁, 滕雨菲, 任娜娜, 魏兴卓, 闫书豪, 樊可心, 王永宏, 陈文康, 张兴华, 朱万超, 徐淑兔, 薛吉全. 201份玉米自交系抗旱表型评价及可塑性分析[J]. 作物学报, 2026, 52(5): 1309-1325. |
| [5] | 杨扬, 常诗惠, 田红丽, 易红梅, 王璐, 任洁, 范亚明, 刘亚维, 王凤格, 赵久然. 不同生态区国审玉米品种的遗传多样性分析[J]. 作物学报, 2026, 52(5): 1352-1364. |
| [6] | 张鸿蓉, 王菲儿, 李盼, 仇海龙, 朱静, 赵连豪, 南运有, 何蔚, 樊志龙, 胡发龙, 柴强, 殷文. 减量20%灌水与25%有机肥替代化肥提高青贮玉米产量的光合特性[J]. 作物学报, 2026, 52(5): 1487-1500. |
| [7] | 杨欣雨, 崔文涛, 迪力尼格尔·阿力木, 汪凯翔, 吴鹏昊, 任姣姣. 玉米穗上叶片数全基因组关联分析和全基因组选择[J]. 作物学报, 2026, 52(5): 1573-1590. |
| [8] | 韩亚鑫, 何冠华, 张小琼, 张登峰, 李永祥, 刘旭洋, 王天宇, 黎裕, 邹华文, 李春辉. 基于RNA-Seq和BSA-Seq联合分析挖掘玉米侧根密度基因资源[J]. 作物学报, 2026, 52(5): 1341-1352. |
| [9] | 蔡宏玮, 于爱忠, 姜科强, 王鹏飞, 王玉珑, 霍建喆, 庞小能, 尹波, 尚永盼. 干旱灌区有机肥替代部分化肥促进甜玉米产量提升的关键机制[J]. 作物学报, 2026, 52(4): 1166-1180. |
| [10] | 田红丽, 杨扬, 范亚明, 易红梅, 郭丹丹, 王凤格, 赵久然. 适于玉米品种鉴定的一套三等位变异SNP新型标记组合[J]. 作物学报, 2026, 52(4): 993-1005. |
| [11] | 杨亚莉, 徐明睿, 马越飞, 海艺蕊, 刘凯栋, 刘万茂, 孙颖. 玉米根尖及整根响应缺铁的转录组比较研究[J]. 作物学报, 2026, 52(4): 1006-1021. |
| [12] | 张超, 郭欢, 李忠玲, 岳淑宁, 赵娜. 基于BSA-seq技术定位玉米籽粒花青素关联基因[J]. 作物学报, 2026, 52(3): 780-789. |
| [13] | 郭向阳, 涂亮, 王栋, 刘鹏飞, 王安贵, 易强, 任洪, 李刚, 祝云芳, 吴迅, 蒋喻林, 田丰, 陈泽辉. 热带Suwan种质在我国玉米种质改良中的创新与利用[J]. 作物学报, 2026, 52(3): 655-664. |
| [14] | 马亮, 马璐, 张舒钰, 章慧敏, 王仁明, 宋旭东, 张振良, 冒宇翔, 陆虎华, 陈国清, 郝德荣, 周广飞. 玉米苞叶数目转录组分析及候选基因鉴定[J]. 作物学报, 2026, 52(3): 790-801. |
| [15] | 孟成, 王哲. 玉米ZmPFK基因家族全基因组鉴定及响应胁迫表达分析[J]. 作物学报, 2026, 52(3): 764-779. |
|
||