欢迎访问作物学报,今天是
作物学报 ›› 2026, Vol. 52 ›› Issue (10): 2886-2897.doi: 10.3724/SP.J.1006.2026.61020
周华1( ), 刘丽华2(), 张笑晴1(), 许乃银3, 屈平平2, 李宏博2, 刘阳娜2, 张明明2, 李亚会2, 许栩3, 徐剑文3,*(), 庞斌双2,*()
Zhou Hua1(), Liu Li-Hua2(), Zhang Xiao-Qing1(), Xu Nai-Yin3, Qu Ping-Ping2, Li Hong-Bo2, Liu Yang-Na2, Zhang Ming-Ming2, Li Ya-Hui2, Xu Xu3, Xu Jian-Wen3,*(), Pang Bin-Shuang2,*()
摘要:
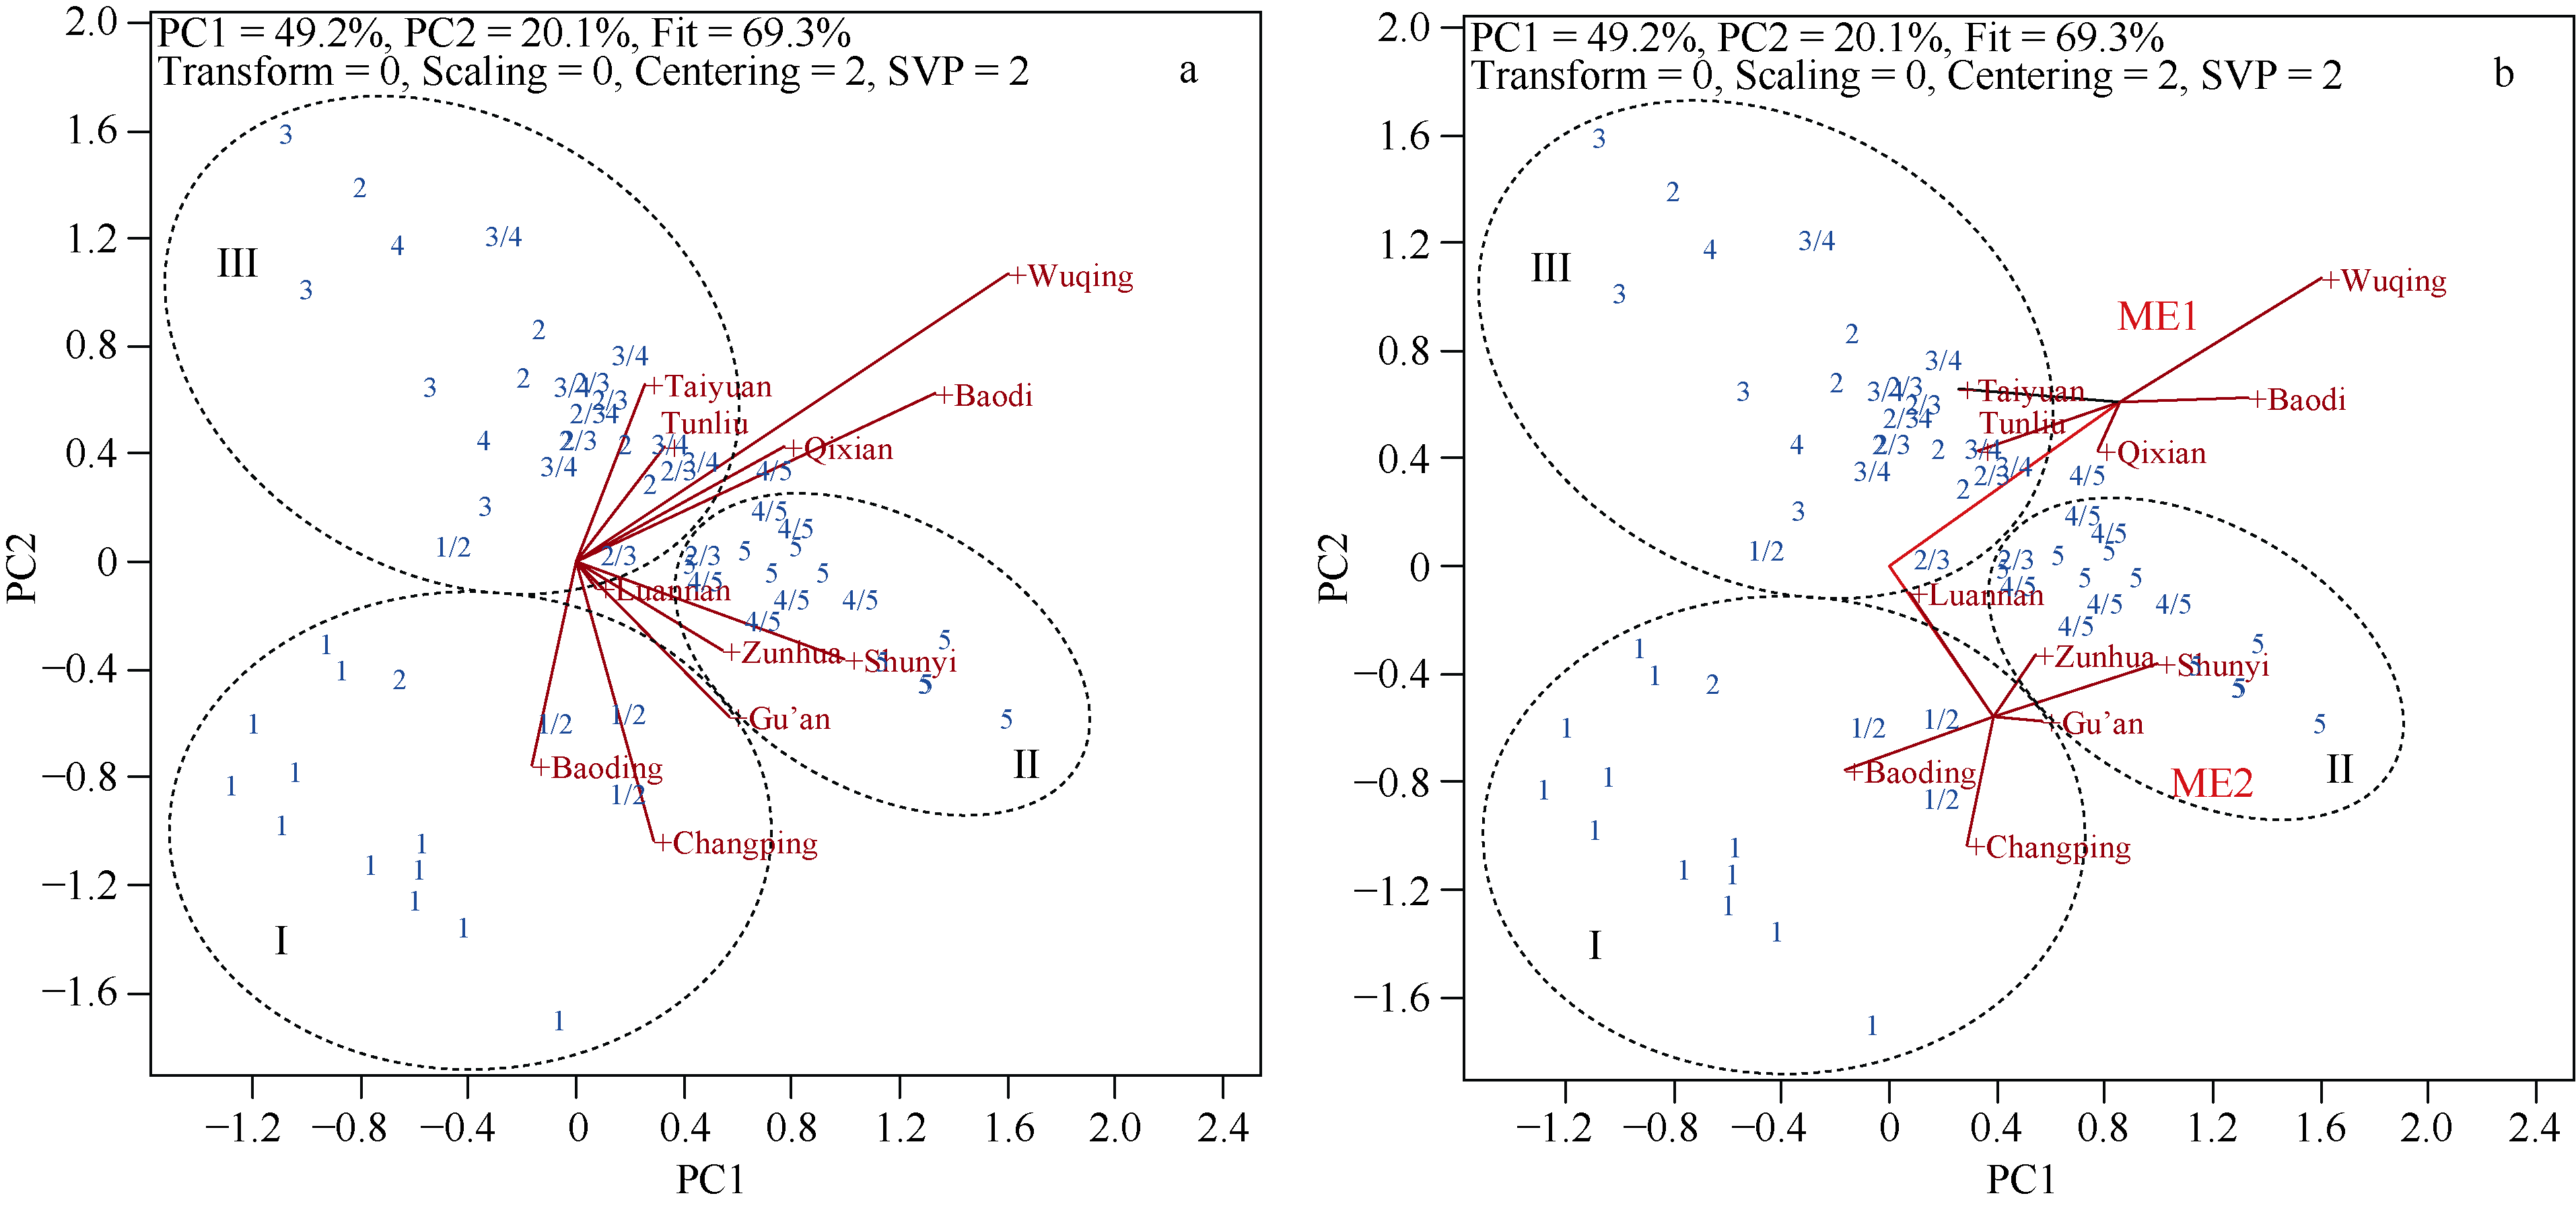
本研究以2021—2025年北部冬麦区水地组国家小麦品种区域试验产量数据为基础, 比较分析原始数据与最佳线性无偏预测值(BLUP)的基因型主效应加基因型与环境互作效应(GGE)双标图在品种生态区划分上的可靠性, 并利用BLUP-GGE双标图对试点进行综合评价和生态亚区划分。结果表明, BLUP-GGE双标图模型拟合度比原始数据GGE双标图提高了13.5%, 对试点的评价更精确可靠。原始数据GGE双标图将试点划分为2个品种生态区, 而在BLUP-GGE双标图中并不存在, 表明传统GGE双标图在分析多年多点品种试验数据上存在一定的局限性。通过BLUP-GGE双标图的试点评价发现, 河北滦南试点综合表现最优秀; 河北固安、天津宝坻和河北遵化试点综合表现优良; 北京昌平、北京顺义、天津武清和河北保定试点综合表现较好; 山西屯留、山西祁县和山西太原试点综合表现一般。采用BLUP-GGE双标图的“哪个赢在哪里”功能图划分的生态亚区仅在试点代表性上有显著差异, 而鉴别力和理想指数无显著差异。采用试点聚类功能图划分的生态亚区在代表性、鉴别力和理想指数上均存在显著差异, 对生态特征表达更加全面, 实用性更强。其中, 第一生态亚区包括河北和天津的全部试点, 占试点总数的60%以上, 是北部冬麦区水地的主体生态亚区, 代表性和理想指数表现最好, 鉴别力较好, 是区域试验的理想试点; 第二生态亚区代表北京市郊的生态环境, 其鉴别力强、代表性中等, 更适用于早期品种选择; 而第三生态亚区包括的山西省屯留和祁县试点因海拔较高和气候冷凉, 鉴别力较差。本研究证实了BLUP-GGE双标图在多年多环境品种试验数据分析中具有一定的优越性, 并提出了一种稳健的试点聚类划分生态亚区的方法, 为优化北部冬麦区水地组小麦区域试验方案和精准推广品种提供了科学依据。
| [1] | 赵广才. 小麦优质高产栽培理论与技术. 北京: 中国农业科学技术出版社, 2018. pp 12-15. |
| Zhao G C. Good Quality and High Yield Cultivation of Wheat:Theory and Technology. Beijing: China Agricultural Science and Technology Press, 2018. pp 12-15 (in Chinese with English abstract). | |
| [2] |
胡学旭, 孙丽娟, 周桂英, 等. 2000-2015年国家黄淮和北部冬麦区域试验品种品质分析. 中国农业科学, 2016, 49: 4677-4686.
doi: 10.3864/j.issn.0578-1752.2016.24.001 |
| Hu X X, Sun L J, Zhou G Y, et al. Quality variation of national tested varieties in Northern Winter Wheat Region and Yellow-Huai River Valley Winter Wheat Region from 2000 to 2015. Sci Agric Sin, 2016, 49: 4677-4686 (in Chinese with English abstract). | |
| [3] |
Sjoberg S M, Carter A H, Steber C M, et al. Unraveling complex traits in wheat: approaches for analyzing genotype×environment interactions in a multienvironment study of falling numbers. Crop Sci, 2020, 60: 3013-3026.
doi: 10.1002/csc2.v60.6 |
| [4] |
Yan W K. A systematic narration of some key concepts and procedures in plant breeding. Front Plant Sci, 2021, 12: 724517.
doi: 10.3389/fpls.2021.724517 |
| [5] |
严威凯. 双标图分析在农作物品种多点试验中的应用. 作物学报, 2010, 36: 1805-1819.
doi: 10.3724/SP.J.1006.2010.01805 |
| Yan W K. Optimal use of biplots in analysis of multi-location variety test data. Acta Agron Sin, 2010, 36: 1805-1819 (in Chinese with English abstract). | |
| [6] |
严威凯. 品种选育与评价的原理和方法评述. 作物学报, 2022, 48: 2137-2154.
doi: 10.3724/SP.J.1006.2022.11105 |
|
Yan W K. A critical review on the principles and procedures for cultivar development and evaluation. Acta Agron Sin, 2022, 48: 2137-2154 (in Chinese with English abstract).
doi: 10.3724/SP.J.1006.2022.11105 |
|
| [7] |
许乃银, 金石桥, 张国伟, 等. HA-GGE双标图在长江流域棉花品种区域试验中的应用. 棉花学报, 2013, 25: 517-524.
doi: 10.11963/cs130607 |
| Xu N Y, Jin S Q, Zhang G W, et al. The effectiveness of HA-GGE biplot application in analyzing the data from the national cotton cultivar regional trial in the Yangtze River valley. Cotton Sci, 2013, 25: 517-524 (in Chinese with English abstract). | |
| [8] |
Gupta V, Mehta G, Kumar S, et al. AMMI and GGE biplot analysis of yield under terminal heat tolerance in wheat. Mol Biol Rep, 2023, 50: 3459-3467.
doi: 10.1007/s11033-023-08298-4 pmid: 36757550 |
| [9] | Ezatollah F, Reza M, Mostafa A, et al. GGE biplot analysis of genotype×environment interaction in wheat-barley disomic addition lines. Aust J Crop Sci, 2012, 6: 1074-1079. |
| [10] | Klomsa-Ard P, Patanothai A, Jaisil P. Efficient test sites for multi-environment evaluation of sugarcane genotypes in Thailand. Int J Plant Prod, 2013, 7: 763-790. |
| [11] |
Yan W K. Mega-environment analysis and test location evaluation based on unbalanced multiyear data. Crop Sci, 2015, 55: 113-122.
doi: 10.2135/cropsci2014.03.0203 |
| [12] | 许乃银, 李健. 利用GGE双标图和综合选择指数划分棉花品种生态区. 中国生态农业学报, 2014, 22: 1113-1121. |
| Xu N Y, Li J. Using GGE biplot and comprehensive selection index to investigate mega-environments of cotton cultivar. Chin J Eco-Agric, 2014, 22: 1113-1121 (in Chinese with English abstract). | |
| [13] |
Fu W, Li S Y, Dai X G, et al. Growth performance and stability analysis of poplar clones based on BLUP and GGE biplot under two different geographic sites in China. Ind Crops Prod, 2025, 230: 121039.
doi: 10.1016/j.indcrop.2025.121039 |
| [14] |
Amrate P K, Nataraj V, Shivakumar M, et al. Best linear unbiased prediction (BLUP)-based models aided in selection of high yielding charcoal rot and yellow mosaic resistant soybean genotypes. Genet Resour Crop Evol, 2025, 72: 5593-5611.
doi: 10.1007/s10722-024-02289-5 |
| [15] |
Piepho H P, Möhring J, Melchinger A E, et al. BLUP for phenotypic selection in plant breeding and variety testing. Euphytica, 2008, 161: 209-228.
doi: 10.1007/s10681-007-9449-8 |
| [16] |
Smith A B, Cullis B R, Thompson R. The analysis of crop cultivar breeding and evaluation trials: an overview of current mixed model approaches. J Agric Sci, 2005, 143: 449-462.
doi: 10.1017/S0021859605005587 |
| [17] | 任丽, 郭敏杰, 苗建利, 等. 基于BLUP和GGE双标图的高油酸花生品种综合分析. 分子植物育种, 2024, 22: 1568-1574. |
| Ren L, Guo M J, Miao J L, et al. Comprehensive analysis of peanut variety with high oleic acid based on BLUP value and GGE-biplot. Mol Plant Breed, 2024, 22: 1568-1574 (in Chinese with English abstract). | |
| [18] |
Liu N, Ding C J, Li B, et al. Analysis of the genotype interaction of four-year-old Populus euramericana using the BLUP-GGE technique. Forests, 2021, 12: 1759.
doi: 10.3390/f12121759 |
| [19] |
Bai L Y, Huang X M, Li Z L, et al. Stability and adaptability of wheat cultivars with low cadmium accumulation based on farmland trials. Eur J Agron, 2023, 144: 126764.
doi: 10.1016/j.eja.2023.126764 |
| [20] |
Tang Q Y, Zhang C X. Data processing system (DPS) software with experimental design, statistical analysis and data mining developed for use in entomological research. Insect Sci, 2013, 20: 254-260.
doi: 10.1111/ins.2013.20.issue-2 |
| [21] | Shivakumar M S, Sunitha N C, Akshitha H J, et al. Predictive power of YREMs and BLUPs for selecting superior genotypes in perennial crops: a black pepper case study. J Appl Res Med Aromat Plants, 2024, 41: 100555. |
| [22] |
Spoorthi V, Ramesh S, Sunitha N C, et al. Are genotypes’ single-year YREMs and BLUPs good predictors of their performance in future years? An empirical analysis in Dolichos bean [Lablab purpureus (L.) Sweet var. Lignosus]. Genet Resour Crop Evol, 2021, 68: 1401-1409.
doi: 10.1007/s10722-020-01070-8 |
| [23] | Yan W K, Kang M S. GGE Biplot Analysis:A Graphical Tool for Breeders, Geneticists, and Agronomists. Boca Raton: CRC Press, 2002. |
| [24] |
Yan W K. GGEbiplot: a windows application for graphical analysis of multienvironment trial data and other types of two-way data. Agron J, 2001, 93: 1111-1118.
doi: 10.2134/agronj2001.9351111x |
| [25] |
Yan W K, Holland J B. A heritability-adjusted GGE biplot for test environment evaluation. Euphytica, 2010, 171: 355-369.
doi: 10.1007/s10681-009-0030-5 |
| [26] |
Mesfin H H. Adaptability and stability for soybean yield by AMMI and GGE models in Ethiopia. Front Plant Sci, 2022, 13: 950992.
doi: 10.3389/fpls.2022.950992 |
| [27] |
Xu N Y, Fok M, Zhang G W, et al. The application of GGE biplot analysis for evaluating test locations and mega-environment investigation of cotton regional trials. J Integr Agric, 2014, 13: 1921-1933.
doi: 10.1016/S2095-3119(13)60656-5 |
| [28] |
Li Z H, Liu N, Zhang W X, et al. Application of BLUP-GGE in growth variation analysis in southern-type Populus deltoides seedlings in different climatic regions. Forests, 2022, 13: 2120.
doi: 10.3390/f13122120 |
| [29] |
Zhang W H, Hu J L, Yang Y M, et al. One compound approach combining factor-analytic model with AMMI and GGE biplot to improve multi-environment trials analysis. J For Res, 2020, 31: 123-130.
doi: 10.1007/s11676-018-0846-8 |
| [30] | 邓丽, 任丽, 郭敏杰, 等. 基于BLUP和GGE双标图的花生产量基因型与环境互作效应分析. 种子, 2024, 43(7): 91-96. |
| Deng L, Ren L, Guo M J, et al. Analysis of the interaction effect between peanut yield genotypes and environment based on BLUP and GGE biplot. Seed, 2024, 43(7): 91-96 (in Chinese with English abstract). | |
| [31] |
许乃银, 金石桥, 李健. 我国棉花品种区域试验重复次数和试点数量的设计. 作物学报, 2016, 42: 43-50.
doi: 10.3724/SP.J.1006.2016.00043 |
|
Xu N Y, Jin S Q, Li J. Design of test location number and replicate frequency in the regional cotton variety trials in China. Acta Agron Sin, 2016, 42: 43-50 (in Chinese with English abstract).
doi: 10.3724/SP.J.1006.2016.00043 |
|
| [32] |
Gauch H G Jr, Zobel R W. Identifying mega-environments and targeting genotypes. Crop Sci, 1997, 37: 311-326.
doi: 10.2135/cropsci1997.0011183X003700020002x |
| [33] |
Yan W K, Pageau D, Frégeau-Reid J, et al. Oat mega-environments and test-locations in Quebec. Can J Plant Sci, 2011, 91: 643-649.
doi: 10.4141/cjps10139 |
| [34] | Kendal E, Sener O. Examination of genotype×environment interactions by GGE biplot analysis in spring durum wheat. Ind J Gene Plant Breed, 2015, 75: 341-348. |
| [35] |
Obua T, Sserumaga J P, Tukamuhabwa P, et al. Unravelling yield and yield-related traits in soybean using GGE biplot and path analysis. Agronomy, 2024, 14: 2826.
doi: 10.3390/agronomy14122826 |
| [36] |
Ma C Y, Liu C R, Ye Z L. Influence of genotype×environment interaction on yield stability of maize hybrids with AMMI model and GGE biplot. Agronomy, 2024, 14: 1000.
doi: 10.3390/agronomy14051000 |
| [37] |
Yan W K. LG biplot: a graphical method for mega-environment investigation using existing crop variety trial data. Sci Rep, 2019, 9: 7130.
doi: 10.1038/s41598-019-43683-9 pmid: 31073232 |
| [38] |
Xu N Y, Qiao Y T, Zhao S Q, et al. Optimizing the test locations and replicates in multi-environmental cotton registration trials in southern Xinjiang, China. Crop Sci, 2022, 62: 1866-1879.
doi: 10.1002/csc2.v62.5 |
| [1] | 雷鹏, 李丽, 袁剑龙, 夏露露, 周小成, 张峰. 马铃薯产量和类黄酮含量的基因型与环境互作分析[J]. 作物学报, 2026, 52(10): 3006-3022. |
| [2] | 张连瑞, 唐振三, 何振明, 宋金凤, 栾倩倩, 杨秋华. 西北地区马铃薯基因型与环境互作效应分析及优异品种筛选[J]. 作物学报, 2026, 52(10): 3142-3152. |
| [3] | 胡亮亮, 周洪妹, 王晓磊, 王素华, 李彩菊, 魏云山, 王丽侠, 程须珍, 陈红霖. 小豆产量相关性状的基因型与环境互作效应及稳定性分析[J]. 作物学报, 2025, 51(10): 2581-2594. |
| [4] | 许乃银, 金石桥, 晋芳, 刘丽华, 徐剑文, 刘丰泽, 任雪贞, 孙全, 许栩, 庞斌双. 基于SNP标记的小麦品种遗传相似度及其检测准确度分析[J]. 作物学报, 2024, 50(4): 887-896. |
| [5] | 邵扬, 郭延平, 周丙月, 张峰, 张兴民, 王玉萍. 蚕豆产量组分的基因型与环境互作及稳定性分析[J]. 作物学报, 2024, 50(1): 149-160. |
| [6] | 严威凯. 品种选育与评价的原理和方法评述[J]. 作物学报, 2022, 48(9): 2137-2154. |
| [7] | 张毅,许乃银,郭利磊,杨子光,张笑晴,杨晓妮. 我国北部冬麦区小麦区域试验重复次数和试点数量的优化设计[J]. 作物学报, 2020, 46(8): 1166-1173. |
| [8] | 叶夕苗,程鑫,安聪聪,袁剑龙,余斌,文国宏,李高峰,程李香,王玉萍,张峰. 马铃薯产量组分的基因型与环境互作及稳定性[J]. 作物学报, 2020, 46(3): 354-364. |
| [9] | 孟繁圆,冯利平,张丰瑶,张祎,伍露,王春雷,闫锦涛,彭明喜,莫志鸿,余卫东. 北部冬麦区冬小麦越冬冻害时空变化特征[J]. 作物学报, 2019, 45(10): 1576-1585. |
| [10] | 许乃银,金石桥,李健. 我国棉花品种区域试验重复次数和试点数量的设计[J]. 作物学报, 2016, 42(01): 43-50. |
| [11] | 罗俊,许莉萍,邱军,张华,袁照年,邓祖湖,陈如凯,阙友雄. 基于HA-GGE双标图的甘蔗试验环境评价及品种生态区划分[J]. 作物学报, 2015, 41(02): 214-227. |
| [12] | 许乃银,李健. 棉花区试中品种多性状选择的理想试验环境鉴别[J]. 作物学报, 2014, 40(11): 1936-1945. |
| [13] | 许乃银,李健. 利用GGE双标图划分长江流域棉花纤维品质生态区[J]. 作物学报, 2014, 40(05): 891-898. |
| [14] | 王春平,胡希远,沈琨仑. 玉米区域试验中误差方差的异质性及其对品种评价的影响[J]. 作物学报, 2013, 39(03): 449-454. |
| [15] | 罗俊,张华,邓祖湖,许莉萍,徐良年,袁照年,阙友雄. 应用GGE双标图分析甘蔗品种(系)的产量和品质性状[J]. 作物学报, 2013, 39(01): 142-152. |
|
||