欢迎访问作物学报,今天是

作物学报 ›› 2021, Vol. 47 ›› Issue (5): 847-859.doi: 10.3724/SP.J.1006.2021.04176

• 作物遗传育种·种质资源·分子遗传学 • 上一篇    下一篇

大豆根部水压胁迫耐逆指数遗传体系解析

王吴彬1, 童飞1,2, KHAN Mueen Alam1, 张雅轩1, 贺建波1, 郝晓帅1, 邢光南1, 赵团结1, 盖钧镒1,*()   

  1. 1南京农业大学大豆研究所 / 国家大豆改良中心 / 农业农村部大豆生物学与遗传育种重点实验室(综合) / 作物遗传与种质创新国家重点实验室 / 江苏作物生产协同创新中心, 江苏南京 210095
    2江苏徐淮地区徐州农业科学研究所, 江苏徐州 221131
  • 收稿日期:2020-07-31 接受日期:2020-11-13 出版日期:2021-05-12 网络出版日期:2020-12-23
  • 通讯作者: 盖钧镒
  • 作者简介:王吴彬, E-mail: soybeanwang@163.com|童飞, E-mail: ttongfei@126.com
  • 基金资助:
    中央高校基本科研业务费专项(KYZZ201901);国家自然科学基金项目(31601325);教育部长江学者和创新团队项目(PCSIRT_17R55);国家现代农业产业技术体系建设专项(CARS-04);江苏省JCIC-MCP项目资助

Detecting QTL system of root hydraulic stress tolerance index at seedling stage in soybean

WANG Wu-Bin1, TONG Fei1,2, KHAN Mueen-Alam1, ZHANG Ya-Xuan1, HE Jian-Bo1, HAO Xiao-Shuai1, XING Guang-Nan1, ZHAO Tuan-Jie1, GAI Jun-Yi1,*()   

  1. 1Soybean Research Institute, Nanjing Agricultural University / National Center for Soybean Improvement / MOA Key Laboratory for Biology and Genetic Improvement of Soybean (General), Ministry of Agriculture and Rural Affairs / National Key Laboratory of Crop Genetics and Germplasm Enhancement / Jiangsu Collaborative Innovation Center for Modern Crop Production, Nanjing 210095, Jiangsu, China
    2Xuzhou Institute of Agricultural Sciences of Xuhuai Region of Jiangsu, Xuzhou 221131, Jiangsu, China
  • Received:2020-07-31 Accepted:2020-11-13 Published:2021-05-12 Published online:2020-12-23
  • Contact: GAI Jun-Yi
  • Supported by:
    Fundamental Research Funds for the Central Universities(KYZZ201901);National Natural Science Foundation of China(31601325);MOE Program for Changjiang Scholars and Innovative Research Team in University(PCSIRT_17R55);China Agriculture Research System(CARS-04);Jiangsu JCIC-MCP

摘要:

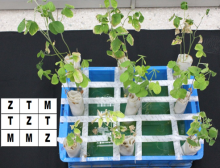
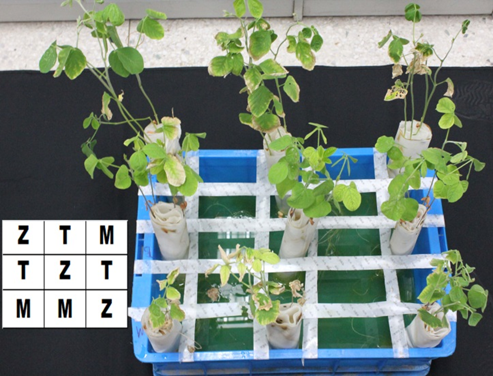
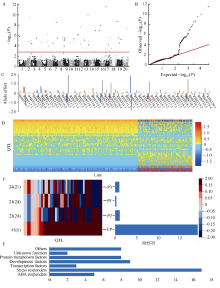
大豆是重要的植物蛋白质和植物油脂来源, 干旱是影响大豆产量的重要环境因子之一。为解析大豆耐旱性的遗传基础, 本研究在PEG水压胁迫条件下, 对由409个家系组成的巢式关联作图群体(具有1个共同亲本的2个重组自交系群体组成)进行叶片脯氨酸含量测定, 通过限制性二阶段多位点全基因组关联分析(restrictive two-stage multilocus genome-wide association study, RTM-GWAS), 解析了大豆根部水压胁迫耐逆指数(root hydraulic stress tolerance index, RHSTI)的遗传体系。结果表明, 在春季和夏季环境下, 3个亲本蒙8260 (共同亲本)、通山薄皮黄豆甲和正阳白毛平顶在RHSTI上均存在显著差异, 其衍生群体RHSTI表型变异丰富, 变幅分别为0.11~2.94和0.03~1.93, 遗传力分别为97.7%和97.9%; 2个环境联合分析发现, 家系遗传力和家系与环境互作遗传力分别为37.9%和60.1%, 说明群体RHSTI的变异受遗传和环境共同控制。通过RTM-GWAS方法, 共检测到45个与RHSTI相关的QTL, 分布在大豆18条染色体上, 可以解释37.58%的表型变异, 其中7个QTL的表型贡献率超过1%, 为大贡献位点; 这些QTL中, 有34个位点与环境存在显著互作, 可以解释12.50%的表型变异。结合PEG胁迫下大豆转录组数据, 在定位区间500 kb范围内共筛选到38个差异表达基因, 可归为ABA响应因子、逆境响应因子、转录因子、发育因子、蛋白代谢因子、未知功能和其他等7类, 其中逆境响应因子、转录因子和发育因子是最大的3类; 其中位于主效位点的6个基因, 与ABA响应因子、逆境响应因子、转录因子相关, 应为主要候选基因。上述结果表明, 大豆耐旱性是一个由多位点、多基因控制的复杂数量性状, 且与环境存在互作, 遗传基础复杂。研究结果为大豆耐旱性分子育种提供了依据。

关键词: 大豆, 根部水压胁迫耐逆指数, 脯氨酸含量, 数量性状位点, 巢式关联作图群体

Abstract:

Soybean is an important source of plant protein and vegetable oil in the world. Drought is one of the important environmental stress factors affecting soybean yield. To explore the genetic base of drought tolerance in soybean, a nested association mapping population composed of two sets of recombinant inbred lines with a common parent in a total of 429 lines was investigated for leaf proline content under PEG simulated drought stress. The genetic system of root hydraulic stress tolerance index (RHSTI) was analyzed using the RTM-GWAS (restrictive two-stage multilocus genome-wide association study). The results showed that there were significant differences in RHSTI among the three parents under two different environments in spring and summer, and among the nested association mapping population with the variation range of 0.11-2.94 and 0.03-1.93, respectively. The heritability values of Line and Line×Environment were 37.9% and 60.1%, respectively, indicating that the variation of RHSTI was greatly affected by the environment. Using the RHSTI data and 6137 SNPLDB markers, a total of 45 main effect QTLs were detected on 18 chromosomes, which could explain a total of 37.58% phenotypic variation, including 7 large contribution QTLs with R 2 more than 1%. Among them, 34 QTLs with QTL×Environment effect explained 12.50% of the phenotypic variation. Combined with the transcriptome data under PEG stress, totally 38 differentially expressed genes were identified within a QTL ± 500 kb, which can be grouped into different biological categories, including ABA responders, stress responders, transcription factors, development factors, protein metabolism factors, unknown functions and others, with stress responses, transcription factors and development factors as the major parts. In summary, the results indicated that the drought tolerance of soybean was a complex quantitative trait, with the complex genetic basis controlling by multiple loci, multiple genes and interaction with the environment. The present results can lay the foundation of molecular breeding for drought tolerance in soybean.

Key words: soybean, root hydraulic stress tolerance index, proline content, QTL, nested association mapping population

表1

文献报道的部分大豆耐旱性位点信息"

作图群体
Mapping population
评价指标
Indicator
QTL数目
QTL number
染色体(QTL数目)a
Chromosome (QTL number)
参考文献
Reference
Benning/PI 416937 萎蔫指数Canopy width 7 2(1) 4(1) 5(1) 12(1) 14(1) 17(1) 19(1) [11]
KS4895/Jackson 萎蔫指数Canopy width 4 8(1) 13(1) 14(1) 17(1) [12]
93705KS4895/Jackson 萎蔫指数Canopy width 13 2(3) 4(1) 5(2) 6(2) 8(1) 14(1) 17(3) [13]
08705KS4895/Jackson 萎蔫指数Canopy width 7 9(1) 11(2) 12(1) 16(1) 17(2) [13]
KS4895/ PI 424140 萎蔫指数Canopy width 4 11(1) 17(1) 19(2) [13]
Benning/PI 416937 萎蔫指数Canopy width 4 2(3) 19(1) [13]
NN1138-2/Kefeng 1 耐旱系数Drought index 10 1(1) 5(2) 6(1) 7(1) 12(1) 16(1) 17(2) 20(1) [14]
Benning/PI 416937 叶片电导率Hydraulic conductance 4 3(1) 5(1) 10(1) 12(1) [15]
S-100/Tokyo 水分利用率Water use efficiency 3 4(2) 19(1) [16]
Young/PI 416937 水分利用率Water use efficiency 6 12(2) 16(3) 18(1) [17]
QTL元分析Meta-QTL 26 2(10) 5(3) 11(4) 12(2) 17(6) 19(3) [18]

表2

MTZ群体及其亲本根部水压胁迫耐逆指数RHSTI的描述性统计"

环境
Environment
M Z T MTZ
组中值(频数) Value of class mid-point (frequency) 变幅
Range
平均数
Mean
变异系数
CV (%)
遗传力
h2
0.1 0.3 0.5 0.7 0.9 1.1 1.3 1.5 1.7 >1.9
春季Spring 0.35 1.05 0.95 1 24 159 128 57 15 9 2 1 9 0.11-2.94 0.69 13.2 97.2
夏季Summer 0.17 1.04 0.96 38 56 75 100 61 34 20 5 0 2 0.03-1.93 0.65 12.1 97.9
平均值Mean 0.26 1.05 0.95 2 41 115 159 55 19 5 6 0 5 0.09-2.80 0.68 12.7 37.9

图1

PEG模拟干旱条件下3个亲本耐旱性表现 图片左侧的字母代表亲本在右侧蓝色箱子中的位置。缩写同表2。"

表3

MTZ群体根部水压胁迫耐逆指数RHSTI两环境联合方差分析"

变异来源
Source of variation
F
F-value
家系 Line 50.54**
环境 Environment 0.80
区组(环境) Block (Environment) 94.89**
家系×环境 Line × Environment 30.38**

表4

MTZ群体中检测到与根部水压胁迫耐逆指数RHSTI相关的QTL"

QTL 连锁不平衡区段
SNPLDB
染色体
Chr.
位置
Position
等位变异数目
AN
主效QTL Main effect QTL QTL与环境互作 QTL×Env a 已报道位点
Reported QTLs
-lg P R2(%) -lg P R2(%)
RHSTI1.1 Gm01_4742892 Gm01 4742892 2 15.4 0.57 12.2 0.44
RHSTI2.1 BLOCK_2_27517291_27687530 Gm02 27517291-27687530 3 18.1 0.72 4.0 0.15
RHSTI2.2 BLOCK_2_39672439_39870477 Gm02 39672439-39870477 3 40.6 1.66 4.4 0.17 mqCanopy wilt-018[18]
RHSTI2.3 BLOCK_2_46859465_47055418 Gm02 46859465-47055418 3 22.0 0.88 NS
RHSTI2.4 BLOCK_2_51400285_51574802 Gm02 51400285-51574802 3 18.8 0.74 6.1 0.24
RHSTI3.1 BLOCK_3_2456930_2505542 Gm03 2456930-2505542 3 14.7 0.58 10.2 0.40
RHSTI3.2 BLOCK_3_43400584_43484318 Gm03 43400584-43484318 3 16.5 0.65 33.4 1.36
RHSTI4.1 BLOCK_4_41364990_41553577 Gm04 41364990-41553577 3 17.1 0.68 2.5 0.10
RHSTI6.1 BLOCK_6_4265210_4332096 Gm06 4265210-4332096 2 21.0 0.79 4.3 0.14
RHSTI6.2 BLOCK_6_4951013_5150438 Gm06 4951013-5150438 3 17.4 0.69 NS
RHSTI6.3 BLOCK_6_13682742_13879752 Gm06 13682742-13879752 3 15.1 0.59 NS
RHSTI7.1 BLOCK_7_945093_1143184 Gm07 945093-1143184 3 16.0 0.63 10.9 0.43
RHSTI7.2 Gm07_27902201 Gm07 27902201 2 35.3 1.39 NS
RHSTI7.3 BLOCK_7_37870093_38067672 Gm07 37870093-38067672 3 15.8 0.62 9.3 0.36
RHSTI8.1 Gm08_42822124 Gm08 42822124 2 18.8 0.70 14.6 0.54
RHSTI9.1 BLOCK_9_5045930_5095878 Gm09 5045930-5095878 3 21.4 0.85 11.9 0.47
RHSTI9.2 Gm09_5673327 Gm09 5673327 2 15.3 0.56 2.2 0.06
RHSTI9.3 BLOCK_9_7453368_7651586 Gm09 7453368-7651586 3 25.5 1.02 NS
RHSTI9.4 BLOCK_9_14835645_14840806 Gm09 14835645-14840806 2 18.5 0.69 3.5 0.11
RHSTI10.1 BLOCK_10_10109602_10137279 Gm10 10109602-10137279 3 18.1 0.72 NS
RHSTI10.2 BLOCK_10_39940500_40129301 Gm10 39940500-40129301 3 24.1 0.96 4.4 0.17 Drought tolerance 6-3[13]
RHSTI10.3 BLOCK_10_40440079_40629141 Gm10 40440079-40629141 3 15.3 0.60 12.2 0.48 Drought tolerance 6-3[13]
RHSTI10.4 BLOCK_10_47418374_47616648 Gm10 47418374-47616648 3 19.7 0.78 3.5 0.14
RHSTI11.1 BLOCK_11_26241368_26440039 Gm11 26241368-26440039 3 15.0 0.59 3.1 0.12 mqCanopy wilt-020[18]
mqCanopy wilt-009[18]
RHSTI11.2 BLOCK_11_29079685_29279006 Gm11 29079685-29279006 3 20.1 0.80 16.6 0.66 mqCanopy wilt-020[18]
RHSTI12.1 BLOCK_12_11206224_11381903 Gm12 11206224-11381903 3 16.3 0.64 11.6 0.45
RHSTI12.2 BLOCK_12_11687384_11857574 Gm12 11687384-11857574 2 73.0 3.09 NS
RHSTI13.1 BLOCK_13_3657693_3729944 Gm13 3657693-3729944 3 14.4 0.57 13.3 0.52
RHSTI13.2 BLOCK_13_35892463_36008531 Gm13 35892463-36008531 3 15.5 0.61 4.1 0.16
RHSTI13.3 BLOCK_13_41064207_41264076 Gm13 41064207-41264076 2 18.1 0.67 NS
RHSTI14.1 BLOCK_14_2645749_2661861 Gm14 2645749-2661861 3 19.9 0.79 5.8 0.22
RHSTI14.2 BLOCK_14_46766676_46936602 Gm14 46766676-46936602 3 20.9 0.83 4.7 0.18 Canopy wilt 2-5[13]
RHSTI15.1 Gm15_38751520 Gm15 38751520 2 34.1 1.34 NS Canopy wilt 2-5[13]
RHSTI15.2 BLOCK_15_49313308_49446734 Gm15 49313308-49446734 2 18.0 0.67 42.6 1.70
RHSTI17.1 BLOCK_17_9162497_9323658 Gm17 9162497-9323658 3 11.7 0.46 5.7 0.22 Drought index 1-9[14]
Canopy wilt 1-3[12]
Canopy wilt 3-10[13]
RHSTI17.2 BLOCK_17_10274061_10289190 Gm17 10274061-10289190 3 59.2 2.51 NS
RHSTI17.3 BLOCK_17_32103917_32299960 Gm17 32103917-32299960 3 14.1 0.55 NS
RHSTI18.1 BLOCK_18_1411394_1609397 Gm18 1411394-1609397 3 25.0 1.00 3.1 0.12
RHSTI18.2 BLOCK_18_4798286_4951218 Gm18 4798286-4951218 3 12.6 0.50 6.4 0.25
RHSTI18.3 BLOCK_18_13133051_13329765 Gm18 13133051-13329765 3 18.3 0.72 7.0 0.27
RHSTI19.1 BLOCK_19_1291865_1491855 Gm19 1291865-1491855 3 17.2 0.68 32.0 1.29
RHSTI19.2 Gm19_17194130 Gm19 17194130 2 12.9 0.47 3.2 0.10
RHSTI19.3 BLOCK_19_23574474_23596371 Gm19 23574474-23596371 2 15.4 0.56 NS
RHSTI19.4 BLOCK_19_35661675_35858974 Gm19 35661675-35858974 3 17.6 0.70 8.3 0.32
RHSTI20.1 BLOCK_20_35376980_35573994 Gm20 35376980-35573994 3 18.7 0.74 4.0 0.15
总计Total 45 123 37.58 12.50

图2

MTZ群体根部水压胁迫耐逆指数的遗传解析 A: MTZ群体中根部水压胁迫耐逆指数全基因组关联分析曼哈顿图。B: MTZ群体中根部水压胁迫耐逆指数全基因组关联分析QQ图。C: 123个RHSTI QTL等位变异效应; 横坐标上方的条柱代表增效等位变异效应, 横坐标下方的条柱代表减效等位变异效应。D: MTZ群体RHSTI QTL-allele矩阵, 横轴为家系, 按根部水压胁迫耐逆指数由左向右递增排列, 竖轴为QTL, 暖色表示增效等位基因, 冷色表示减效等位基因, 颜色深度表示等位基因效应的大小。E: 3个亲本和最优后代的表型及其遗传结构; 括号内外的数字分别代表材料携带减效与增效等位变异数目; P1、P2、P3和EP分别代表3个亲本蒙8206、正阳白毛平顶、通山薄皮黄豆甲与聚合所有最优等位变异的后代。F: RHSTI候选基因GO功能聚类分析。"

表5

转录组与GWAS相结合的根部水压胁迫耐逆指数RHSTI候选基因分析"

基因
Gene
QTL 对照
Control
处理
Treatment
A S T D PM UF O
Glyma.01G044100 RHSTI1.1 4.63315 26.99810
Glyma.02G171100 RHSTI2.1 1.65710 35.83620
Glyma.02G196500 RHSTI2.2 13.39870 54.69290
Glyma.02G250200 RHSTI2.3 10.60250 154.59800
Glyma.02G308100 RHSTI2.4 20.68510 89.04400
Glyma.03G023900 RHSTI3.1 10.74360 39.75440
Glyma.03G202400 RHSTI3.2 46.58860 2.89863
Glyma.04G179500 RHSTI4.1 615.19900 78.03500
Glyma.06G054700 RHSTI6.1 0.27378 132.47900
Glyma.06G063500 RHSTI6.2 5.58627 26.31760
Glyma.06G165100 RHSTI6.3 16.17140 3.43912
Glyma.07G013900 RHSTI7.1 119.39400 5.21799
Glyma.07G208700 RHSTI7.3 59.19030 196.58300
Glyma.08G316700 RHSTI8.1 8.69897 187.91100
Glyma.09G051700 RHSTI9.1 0.00001 40.02450
Glyma.09G071600 RHSTI9.3 5.55258 142.93600
Glyma.10G081700 RHSTI10.1 18.56970 69.58230
Glyma.10G169300 RHSTI10.2 3.97157 66.91020
Glyma.10G179200 RHSTI10.3 32.64080 6.27830
Glyma.10G251900 RHSTI10.4 248.40400 501.60600
Glyma.11G171400 RHSTI11.1 8.60429 102.58700
Glyma.11G207000 RHSTI11.2 1.99196 20.33400
Glyma.12G112100 RHSTI12.1 64.63140 29.13040
基因
Gene
QTL 对照
Control
处理
Treatment
A S T D PM UF O
Glyma.12G117000 RHSTI12.2 3.83243 33.14560
Glyma.13G078400 RHSTI13.1 49.82870 14.74430
Glyma.13G272000 RHSTI13.2 56.77120 135.84100
Glyma.13G333100 RHSTI13.3 44.62830 847.65000
Glyma.14G190800 RHSTI14.2 36.08840 9.31428
Glyma.15G222200 RHSTI15.1 19.02410 1.79038
Glyma.15G267900 RHSTI15.2 2.69447 34.25220
Glyma.17G113100 RHSTI17.1 79.26370 26.09940
Glyma.17G122900 RHSTI17.2 46.38730 23.03860
Glyma.17G202600 RHSTI17.3 0.73104 40.50930
Glyma.18G018600 RHSTI18.1 9.17402 136.37000
Glyma.19G014800 RHSTI19.1 31.60140 7.32146
Glyma.19G100600 RHSTI19.3 53.01000 13.26570
Glyma.19G109400 RHSTI19.4 25.26790 129.41800
Glyma.19G112700 RHSTI20.1 119.13700 37.92940

表6

多个耐旱指标评价MTZ群体检测到的QTL簇(±500 kb)"

序号
Order
QTL 染色体
Chr.
物理位置
Physical position
序号
Order
QTL 染色体
Chr.
物理位置
Physical position
1 RHSTI3.2/RRL3.5 Gm03 43400584-43484318 10 RRL14.1/RPDW14.2 Gm14 47717307-48064975
2 RSL4.2/RPL4.1 Gm04 44742587-45097286 11 RRL15.1/RSL15.1 Gm15 11105948-11421179
3 RHSTI6.3/RRL6.2 Gm06 13682742-13879752 12 RHSTI15.2/RRL15.4 Gm15 48985599-49446734
4 RHSTI7.3/RRL7.2 Gm07 37870093-38067672 13 RHSTI17.3/RRL17.2 Gm17 32103917-34132465
5 RHSTI10.3/RRL10.2 Gm10 40440079-40629141 14 RHSTI18.1/RPL18.1 Gm18 1411394-2099117
6 RRL10.3/RPDW10.1 Gm10 50470068-50478746 15 RHSTI19.2/RSL19.3 Gm19 16552234-17194130
7 RPL13.2/RPDW13.1 Gm 13 22001544-22395896 16 RHSTI19.4/RRL19.3 Gm19 35661675-35924257
8 RHSTI13.2/RSL13.1 Gm 13 35347991-36008531 17 RRL19.5/RPDW19.1 Gm19 37678898-38456131
9 RRL13.6/RPL13.1 Gm 13 43533843-43640816 18 RHSTI20.1/RPL20.1 Gm20 35319103-35573994
[1] Reynolds J F, Smith D M S, Lambin E F, Turner B L, Mortimore M, Batterbury S P J, Downing T E, Dowlatabadi H, Fernández R J, Herrick J E, Huber-Sannwald E, Jiang H, Leemans R, Lynam T, Maestre F T, Ayarza M, Walker B. Global desertification: Building a science for dryland development. Science, 2007,316:847-851.
[2] Cook E R, Seager R, Cane M A, Stahle D W. North American drought: reconstructions, causes, and consequences. Earth Sci Rev, 2007,81:93-134.
[3] Frederick J R, Camp C R, Bauer P J. Drought-stress effects on branch and mainstem seed yield and yield components of determinate soybean. Crop Sci, 2001,41:759-763.
[4] Sadeghipour O, Abbasi S. Soybean response to drought and seed inoculation. World Appl Sci J, 2012,17:55-60.
[5] Sloane R J, Patterson R P, Carter T E. Field drought tolerance of a soybean plant introduction. Crop Sci, 1990,30:118-123.
[6] 刘莹, 盖钧镒, 吕慧能, 王永军, 陈受宜. 大豆耐旱种质鉴定和相关根系性状的遗传与QTL定位. 遗传学报, 2005,32:855-863.
Liu Y, Gai J Y, Lyu H N, Wang Y J, Chen S Y. Identification of drought tolerant germplasm and inheritance and QTL mapping of related root traits in soybean (Glycine max(L.) Merr.). Acta Genet Sin, 2005,32:855-863 (in Chinese with English abstract).
[7] Liu F, Andersen M N, Jacobsen S E, Jensen C R. Stomatal control and water use efficiency of soybean (Glycine max L. Merr.) during progressive soil drying. Environ Exp Bot, 2005,54:33-40.
[8] Guo Y, Yu H, Yang M, Kong D, Zhang Y. Effect of drought stress on lipid peroxidation, osmotic adjustment and antioxidant enzyme activity of leaves and roots of Lycium ruthenicum Murr. seedling. Russ J Plant Physiol, 2018,65:244-250.
[9] 耶兴元, 何晖, 张燕, 朱献辉. 脯氨酸对高温胁迫下猕猴桃苗抗热性相关生理指标的影响. 山东农业科学, 2010, (5):44-46.
Ye X Y, He H, Zhang Y, Zhu X H. Effects of proline on physiological indexes related to heat resistance of kiwifruit seedlings under high temperature stress. Shandong Agric Sci, 2010, (5):44-46 (in Chinese with English abstract).
[10] 王涛, 田雪瑶, 谢寅峰, 张往祥. 植物耐热性研究进展. 云南农业大学学报(自然科学), 2013,28:719-726.
Wang T, Tian X Y, Xie Y F, Zhang W X. Research advance on heat-stress tolerance in plants. J Yunnan Agric Univ (Nat Sci), 2013,28:719-726 (in Chinese with English abstract).
[11] Abdel-Haleem H, Carter T E, Purcell L C, King C A, Ries L L, Chen P Y, Schapaugh W, Sinclair T R, Boerma H R Mapping of quantitative trait loci for canopy-wilting trait in soybean (Glycine max L. Merr.). Theor Appl Genet, 2012,125:837-846.
[12] Charlson D V, Bhatnagar S, King C A, Ray J D, Sneller C H, Carter T E, Purcell L C. Polygenic inheritance of canopy wilting in soybean [Glycine max (L.) Merr.]. Theor Appl Genet, 2009,119:587-594.
[13] Hwang S D, King C A, Ray J D, Cregan P B, Chen P, Carter T E, Li Z L, Abdel-Haleem H, Matson K W, Schapaugh W, Purcell L C. Confirmation of delayed canopy wilting QTLs from multiple soybean mapping populations. Theor Appl Genet, 2015,128:2047-2065.
[14] Du W J, Wang M, Fu S X, Yu D Y. Mapping QTLs for seed yield and drought susceptibility index in soybean (Glycine max L.) across different environments. J Genet Genomics, 2009,36:721-731.
[15] Carpentieri-Pipolo V, Pipolo A E, Abdel-Haleem H, Boerma H R, Sinclair T R. Identification of QTLs associated with limited leaf hydraulic conductance in soybean. Euphytica, 2012,186:679-686.
[16] Mian M A R, Ashley D A, Boerma H R. An additional QTL for water use efficiency in soybean. Crop Sci, 1998,38:390-393.
[17] Mian M A R, Bailey M A, Ashley D A, Wells R, Carter T E, Parrott W A, Boerma H R. Molecular markers associated with water use efficiency and leaf ash in soybean. Crop Sci, 1996,36:1252-1257.
[18] Hwang S, King C A, Chen P Y, Ray J D, Cregan P B, Carter T E, Li Z L, Abdel-Haleem H, Matson K W, Schapaugh W, Purcell L C. Meta-analysis to refine map position and reduce confidence intervals for delayed-canopy-wilting QTLs in soybean. Mol Breed, 2016,36.
[19] Khan M A, Tong F, Wang W B, He J B, Zhao T J, Gai J Y. Using the RTM-GWAS procedure to detect the drought tolerance QTL-allele system at the seedling stage under sand culture in a half-sib population of soybean [Glycine max (L.) Merr.]. Can J Plant Sci, 2019,99:801-814.
[20] Khan M A, Tong F, Wang W B, He J B, Zhao T J, Gai J Y. Analysis of QTL-allele system conferring drought tolerance at seedling stage in a nested association mapping population of soybean [Glycine max (L.) Merr.] using a novel GWAS procedure. Planta, 2019,249:1653-1653.
[21] 张志良, 瞿伟菁. 植物生理学实验指导. 北京: 高等教育出版社, 2003. pp 258-260.
Zhang Z L, Qu W J. Guide to Plant Physiology. Beijing: High Education Press, 2003. pp 258-260(in Chinese).
[22] Sayed M A, Schumann H, Pillen K, Naz A A, Leon J. AB-QTL analysis reveals new alleles associated to proline accumulation and leaf wilting under drought stress conditions in barley (Hordeum vulgare L.). BMC Genetics, 2012,13:61.
[23] Andolfatto P, Davison D, Erezyilmaz D, Hu T T, Mast J, Sunayama-Morita T, Stern D L. Multiplexed shotgun genotyping for rapid and efficient genetic mapping. Genome Res, 2011,21:610-617.
[24] Li R Q, Yu C, Li Y R, Lam T W, Yiu S M, Kristiansen K, Wang J. SOAP2: an improved ultrafast tool for short read alignment. Bioinformatics, 2009,25:1966-1967.
[25] Yi X, Liang Y, Huerta-Sanchez E, Jin X, Cuo Z X P, Pool J E, Xu X, Jiang H, Vinckenbosch N, Korneliussen T S, Zheng H C, Liu T, He W M, Li K, Luo R B, Nie X F, Wu H L, Zhao M R, Cao H Z, Zou J, Shan Y, Li S Z, Yang Q, Asan, Ni P X, Tian G, Xu J M, Liu X A, Jiang T, Wu R H, Zhou G Y, Tang M F, Qin J J, Wang T, Feng S J, Li G H, Huasang,Luosang J B, Wang W, Chen F, Wang Y D, Zheng X G, Li Z, Bianba Z M, Yang G, Wang X P, Tang S H, Gao G Y, Chen Y, Luo Z, Gusang L, Cao Z, Zhang Q H, Ouyang W H, Ren X L, Liang H Q, Zheng H S, Huang Y B, Li J X, Bolund L, Kristiansen K, Li Y R, Zhang Y, Zhang X Q, Li R Q, Li S G, Yang H M, Nielsen R, Wang J, Wang J A. Sequencing of 50 human exomes reveals adaptation to high altitude. Science, 2010,329:75-78.
[26] Scheet P, Stephens M. A fast and flexible statistical model for large-scale population genotype data: applications to inferring missing genotypes and haplotypic phase. Am J Hum Genet, 2006,78:629-644.
[27] Barrett J, Fry B, Maller J, Daly M. Haploview: analysis and visualization of LD and haplotype maps. Bioinformatics, 2005,21:263-265.
[28] He J, Meng S, Zhao T, Xing G, Yang S, Li Y, Guan R, Lu J, Wang Y, Xia Q, Yang B, Gai J. An innovative procedure of genome-wide association analysis fits studies on germplasm population and plant breeding. Theor Appl Genet, 2017,130:2327-2343.
[29] Barik S R, Pandit E, Mohanty S P, Nayak D K, Pradhan S K. Genetic mapping of physiological traits associated with terminal stage drought tolerance in rice. BMC Genetics, 2020,21:1-12.
[30] Ilyas N, Amjid M W, Saleem M A, Khan W, Wattoo F M, Rana R M, Maqsood, Rana H, Zahid A, Shah G A, Anwar A. Ahmad M Q, Shaheen M, Riaz H, Ansari M J. Quantitative trait loci (QTL) mapping for physiological and biochemical attributes in a Pasban 90/Frontana recombinant inbred lines (RILs) population of wheat ( Triticum aestivum) under salt stress condition. Saudi J Biol Sci, 2020,27:341-351.
[31] Zhang C, Jin F, Li S, Liu W, Ma X, Yang S, Li X. Fine mapping of major QTLs for alkaline tolerance at the seedling stage in maize (Zea mays L.) through genetic linkage analysis combined with high-throughput DNA sequencing. Euphytica, 2018,214:120.
[1] 陈玲玲, 李战, 刘亭萱, 谷勇哲, 宋健, 王俊, 邱丽娟. 基于783份大豆种质资源的叶柄夹角全基因组关联分析[J]. 作物学报, 2022, 48(6): 1333-1345.
[2] 杨欢, 周颖, 陈平, 杜青, 郑本川, 蒲甜, 温晶, 杨文钰, 雍太文. 玉米-豆科作物带状间套作对养分吸收利用及产量优势的影响[J]. 作物学报, 2022, 48(6): 1476-1487.
[3] 王炫栋, 杨孙玉悦, 高润杰, 余俊杰, 郑丹沛, 倪峰, 蒋冬花. 拮抗大豆斑疹病菌放线菌菌株的筛选和促生作用及防效研究[J]. 作物学报, 2022, 48(6): 1546-1557.
[4] 于春淼, 张勇, 王好让, 杨兴勇, 董全中, 薛红, 张明明, 李微微, 王磊, 胡凯凤, 谷勇哲, 邱丽娟. 栽培大豆×半野生大豆高密度遗传图谱构建及株高QTL定位[J]. 作物学报, 2022, 48(5): 1091-1102.
[5] 李阿立, 冯雅楠, 李萍, 张东升, 宗毓铮, 林文, 郝兴宇. 大豆叶片响应CO2浓度升高、干旱及其交互作用的转录组分析[J]. 作物学报, 2022, 48(5): 1103-1118.
[6] 彭西红, 陈平, 杜青, 杨雪丽, 任俊波, 郑本川, 罗凯, 谢琛, 雷鹿, 雍太文, 杨文钰. 减量施氮对带状套作大豆土壤通气环境及结瘤固氮的影响[J]. 作物学报, 2022, 48(5): 1199-1209.
[7] 王好让, 张勇, 于春淼, 董全中, 李微微, 胡凯凤, 张明明, 薛红, 杨梦平, 宋继玲, 王磊, 杨兴勇, 邱丽娟. 大豆突变体ygl2黄绿叶基因的精细定位[J]. 作物学报, 2022, 48(4): 791-800.
[8] 李瑞东, 尹阳阳, 宋雯雯, 武婷婷, 孙石, 韩天富, 徐彩龙, 吴存祥, 胡水秀. 增密对不同分枝类型大豆品种同化物积累和产量的影响[J]. 作物学报, 2022, 48(4): 942-951.
[9] 杜浩, 程玉汉, 李泰, 侯智红, 黎永力, 南海洋, 董利东, 刘宝辉, 程群. 利用Ln位点进行分子设计提高大豆单荚粒数[J]. 作物学报, 2022, 48(3): 565-571.
[10] 周悦, 赵志华, 张宏宁, 孔佑宾. 大豆紫色酸性磷酸酶基因GmPAP14启动子克隆与功能分析[J]. 作物学报, 2022, 48(3): 590-596.
[11] 王娟, 张彦威, 焦铸锦, 刘盼盼, 常玮. 利用PyBSASeq算法挖掘大豆百粒重相关位点与候选基因[J]. 作物学报, 2022, 48(3): 635-643.
[12] 董衍坤, 黄定全, 高震, 陈栩. 大豆PIN-Like (PILS)基因家族的鉴定、表达分析及在根瘤共生固氮过程中的功能[J]. 作物学报, 2022, 48(2): 353-366.
[13] 张国伟, 李凯, 李思嘉, 王晓婧, 杨长琴, 刘瑞显. 减库对大豆叶片碳代谢的影响[J]. 作物学报, 2022, 48(2): 529-537.
[14] 宋丽君, 聂晓玉, 何磊磊, 蒯婕, 杨华, 郭安国, 黄俊生, 傅廷栋, 汪波, 周广生. 饲用大豆品种耐荫性鉴定指标筛选及综合评价[J]. 作物学报, 2021, 47(9): 1741-1752.
[15] 曹亮, 杜昕, 于高波, 金喜军, 张明聪, 任春元, 王孟雪, 张玉先. 外源褪黑素对干旱胁迫下绥农26大豆鼓粒期叶片碳氮代谢调控的途径分析[J]. 作物学报, 2021, 47(9): 1779-1790.
Viewed
Full text


Abstract

Cited

  Shared   
  Discussed   
No Suggested Reading articles found!