欢迎访问作物学报,今天是

作物学报 ›› 2023, Vol. 49 ›› Issue (5): 1262-1271.doi: 10.3724/SP.J.1006.2023.24118

• 作物遗传育种·种质资源·分子遗传学 • 上一篇    下一篇

棉花纤维质量指数的构建与WGT双标图分析

许乃银1(), 王扬2, 王丹涛2, 宁贺佳2, 杨晓妮1, 乔银桃1   

  1. 1江苏省农业科学院经济作物研究所, 江苏南京 210014
    2中国纤维质量监测中心, 北京 100007
  • 收稿日期:2022-05-13 接受日期:2022-09-05 出版日期:2023-05-12 网络出版日期:2022-09-13
  • 作者简介:E-mail: naiyin@126.com
  • 基金资助:
    中国纤维质量监测中心项目(ZQJ4-2021-040)

Construction of cotton fiber quality index and weighted genotype by trait (WGT) biplot analysis

XU Nai-Yin1(), WANG Yang2, WANG Dan-Tao2, NING He-Jia2, YANG Xiao-Ni1, QIAO Yin-Tao1   

  1. 1Institute of Industrial Crops, Jiangsu Academy of Agricultural Sciences, Nanjing 210014, Jiangsu, China
    2China Fiber Quality Monitoring Center, Beijing 100007, China
  • Received:2022-05-13 Accepted:2022-09-05 Published:2023-05-12 Published online:2022-09-13
  • Supported by:
    Project from China Fiber Quality Monitoring Center(ZQJ4-2021-040)

摘要:

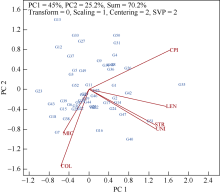
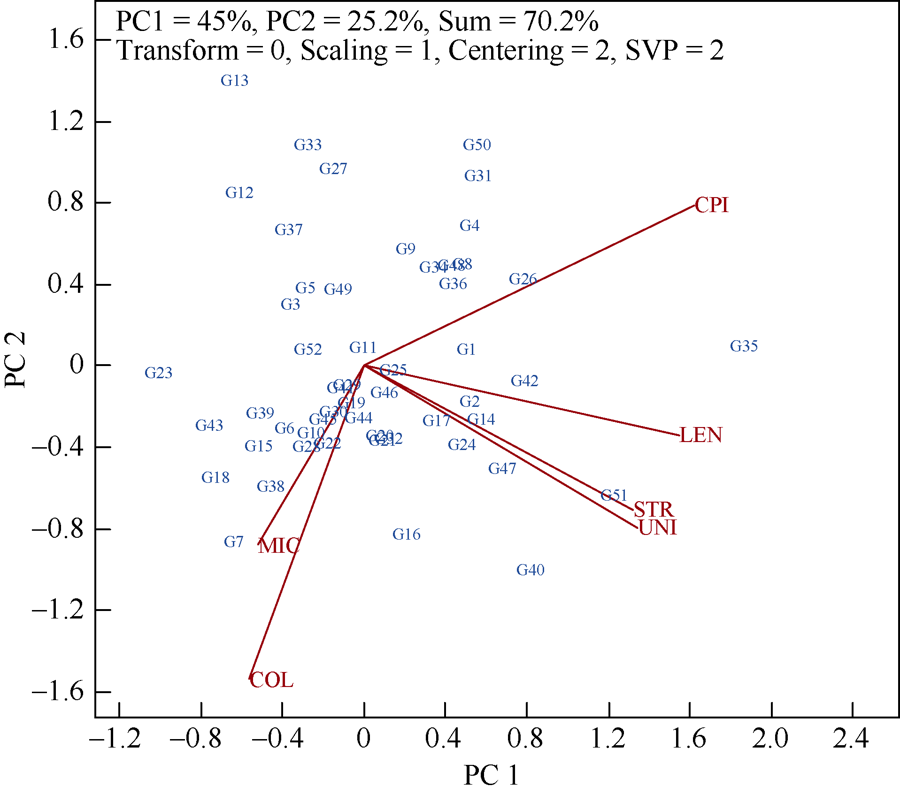
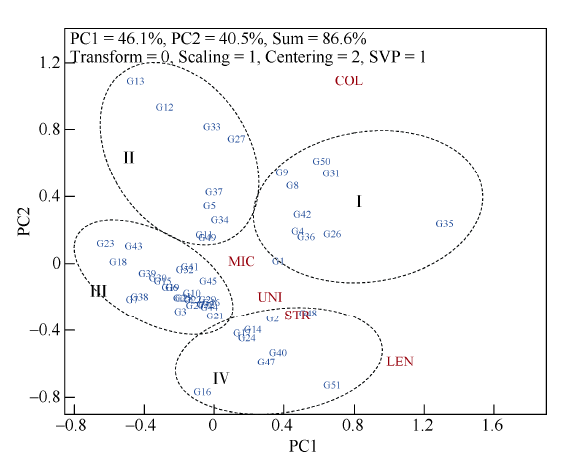
棉花纤维质量受到多项纤维性状的共同作用和影响, 科学构建纤维综合评价指数有利于客观评价棉花纤维的总体质量水平。本研究采用2019—2021年期间中国纤维质量监测中心在新疆主产棉区的棉纤维质量抽检数据构建了棉纤维质量指数模型, 并采用WGT双标图方法对质量指数进行可视化分析和品种分类评价。结果表明, (1) 棉纤维综合评价指数的构成因子及权重分别为纤维长度(权重为0.451)、整齐度(0.173)、比强度(0.285)、马克隆值(-0.117)和颜色级(-0.526)。(2) 基于纤维品质综合评价指数(CEI)和性状协调指数(TCI)构建了纤维质量指数(FQI), 并筛选出新陆中64、新陆早78和中棉113等综合纤维质量表现最好的品种, 以及新陆早67、新陆早54、酒棉18号和新陆中78等综合纤维质量表现较差的品种。(3) 用WGT双标图实现对纤维品质综合评价指数、性状协调指数和纤维质量指数的可视化分析。(4) 采用WGT双标图分析方法将纤维质量监测抽检的52个棉花品种划分为4个特征明显的品种类型, 其中, I型品种的纤维综合表现最好; II型品种综合表现较差; III型品种性状协调指数表现最好, 其余性状表现差; IV型品种颜色级表现差, 其余性状表现较好。本研究在对主产棉区棉花纤维品质指标广泛抽样的基础上采用逐步回归分析的方法构建了纤维综合评价指数, 并结合性状协调指数建立了纤维质量指数, 同时采用WGT双标图方法实现了可视化分析, 可为科学制定中国棉花纤维质量指数提供理论支持, 也为其他类似的品种多性状数据分析提供了应用范例。

关键词: 棉花(Gossypium hirsutum L.), 纤维质量指数, GT双标图, WGT双标图, 逐步回归分析, 聚类分析

Abstract:

Cotton fiber quality is determined by multiple fiber traits. Construction of a cotton fiber evaluation index is important for comprehensive and objective evaluation of cotton cultivars for their fiber quality. A cotton fiber quality index model was constructed based on the cotton fiber quality monitoring data collected by the China Fiber Quality Monitoring Center in the main cotton producing regions in Xinjiang during 2019-2021, and a weighted genotype by trait (WGT) biplot method was developed for visual evaluation of cotton cultivars for their fiber quality index (FQI) and trait profile. The results showed that (1) The key traits and assigned weights were fiber length (weight = 0.451, the same below), uniformity (0.173), strength (0.285), micronaire value (-0.117) and color grade ordination (-0.526), respectively. (2) The FQI was constructed based on fiber comprehensive evaluation index (CEI) and fiber trait consistency index (TCI), and the cotton cultivars classified as having superior FQI included Xinluzhong 64, Xinluzao 78, and Zhongmian 113, while Xinluzao 67, Xinluzao 54, Jiumian 18, and Xinluzhong were identified as poor in FQI. (3) WGT biplot was developed and used to graphically display the fiber quality comprehensive evaluation index, trait consistency index, and fiber quality index. (4) 52 cotton varieties sampled in the fiber quality monitoring action were clustered into four variety type groups. Cluster I was the best in almost all fiber traits, while cluster II was the worst in most traits. Cluster III showed best performance in fiber trait consistency index, but poor in other traits or indexes. Cluster IV was high in fiber color grade but low in other aspects. The methods and results reported in this research will provide a theoretical support for the construction of nationwide cotton fiber quality index model and serve as a model for other crops kinds.

Key words: cotton (Gossypium hirsutum L.), fiber quality index (FQI), genotype by trait (GT) biplot, weighted genotype by trait (WGT) biplot, stepwise regression analysis, clustering analysis

表1

2019-2021年新疆棉花质量监测抽检棉花品种纤维性状表"

代码
Code
品种
Cultivar name
LEN UNI STR MIC COL CPI CEI TCI FQI TYPE
G1 17-68 29.5 83.3 29.6 4.8 4.9 22,991 0.47 0.15 0.49 I
G2 J206-5 29.8 83.2 30.2 4.6 6.2 22,791 0.44 0.25 0.48 IV
G3 J8031 29.1 80.5 29.1 4.4 7.3 22,541 -0.51 0.30 0.18 III
G4 巴43541 Ba 43541 29.7 83.0 28.1 4.2 4.1 22,991 0.65 0.27 0.55 I
G5 冀杂708 Jiza 708 28.7 82.0 28.0 4.8 4.7 22,491 -0.17 0.22 0.29 II
G6 金垦108 Jinken 108 28.7 82.3 28.8 4.8 6.9 22,191 -0.47 0.13 0.20 III
G7 酒棉18号 Jiumian 18 28.5 83.0 27.6 5.5 7.6 22,091 -0.93 0.22 0.05 III
G8 鲁泰19-1 Lutai 19-1 29.0 82.8 30.4 4.8 3.1 23,091 0.63 0.36 0.53 I
G9 鲁泰19-2 Lutai 19-2 28.9 82.1 30.2 4.9 3.0 22,891 0.47 0.41 0.48 I
G10 瑞杂818 Ruiza 818 28.9 82.8 28.4 4.8 6.8 22,191 -0.33 0.13 0.24 III
G11 瑞杂820 Ruiza 820 28.7 83.2 28.0 4.8 5.4 22,641 -0.14 0.14 0.30 II
G12 神牛17 Shenniu17 27.5 81.4 28.1 4.8 3.2 22,491 -0.45 0.64 0.18 II
G13 神牛18 Shenniu 18 27.1 81.2 27.6 4.2 3.0 22,591 -0.54 0.77 0.14 II
G14 塔河2号 Tahe 2 29.5 83.6 30.8 4.3 6.8 22,691 0.41 0.26 0.47 IV
G15 天丰67 Tianfeng 67 28.7 82.8 27.2 5.0 6.9 22,091 -0.64 0.14 0.14 III
G16 新陆早42 Xinluzao 42 29.5 83.4 29.9 4.7 8.7 22,441 -0.18 0.50 0.27 IV
G17 新陆早49 Xinluzao 49 29.6 83.1 29.7 4.5 7.0 22,691 0.15 0.28 0.39 IV
G18 新陆早54 Xinluzao 54 28.0 82.3 28.5 5.3 7.0 22,091 -0.96 0.24 0.04 III
G19 新陆早57 Xinluzao 57 28.6 83.0 29.1 4.6 6.9 22,491 -0.35 0.20 0.24 III
G20 新陆早63 Xinluzao 63 28.9 83.1 29.9 4.6 7.0 22,491 -0.15 0.21 0.30 III
G21 新陆早64 Xinluzao 64 29.3 83.2 28.6 4.8 7.0 22,541 -0.13 0.22 0.30 III
G22 新陆早65 Xinluzao 65 28.9 82.5 29.4 4.9 6.9 22,341 -0.31 0.16 0.25 III
G23 新陆早67 Xinluzao 67 27.9 81.2 27.8 4.9 6.8 21,941 -1.10 0.24 0 III
G24 新陆早71 Xinluzao 71 29.6 83.6 30.2 4.5 7.0 22,691 0.27 0.29 0.43 IV
G25 新陆早72 Xinluzao 72 28.7 83.8 28.5 4.0 7.0 22,441 -0.12 0.27 0.31 III
G26 新陆早78 Xinluzao 78 29.8 83.2 30.4 4.5 3.7 23,041 0.99 0.25 0.65 I
G27 新陆早80 Xinluzao 80 28.5 81.9 27.6 4.6 3.0 22,741 0.08 0.48 0.36 II
G28 新陆早84 Xinluzao 84 28.9 82.7 28.8 4.8 7.0 22,191 -0.38 0.15 0.23 III
G29 新陆中32 Xinluzhong 32 29.2 82.9 27.8 4.5 6.7 22,391 -0.20 0.19 0.28 III
G30 新陆中37 Xinluzhong 37 28.4 83.4 28.6 4.5 6.9 22,341 -0.41 0.23 0.21 III
G31 新陆中40 Xinluzhong 40 29.8 83.5 26.4 4.5 2.5 23,091 0.82 0.53 0.57 I
G32 新陆中55 Xinluzhong 55 29.1 83.6 28.8 4.7 6.8 22,541 -0.12 0.18 0.31 III
G33 新陆中58 Xinluzhong 58 28.2 81.7 27.4 4.5 3.0 22,741 -0.10 0.53 0.30 II
G34 新陆中62 Xinluzhong 62 28.5 83.1 29.8 4.2 4.8 22,891 0.22 0.23 0.41 II
G35 新陆中64 Xinluzhong 64 30.4 85.0 33.5 4.9 1.9 23,791 2.07 0.49 0.84 I
G36 新陆中66 Xinluzhong 66 29.7 82.5 29.6 4.6 4.1 22,891 0.63 0.25 0.54 I
G37 新陆中67 Xinluzhong 67 28.7 81.5 27.1 4.7 4.4 22,541 -0.23 0.30 0.27 II
G38 新陆中68 Xinluzhong 68 28.3 82.5 29.2 5.1 7.5 22,241 -0.76 0.24 0.11 III
G39 新陆中70 Xinluzhong 70 28.5 82.6 27.4 4.9 6.9 22,191 -0.71 0.15 0.12 III
G40 新陆中71 Xinluzhong 71 29.7 84.6 32.1 5.1 6.8 22,791 0.57 0.40 0.51 IV
G41 新陆中73 Xinluzhong 73 28.7 83.1 28.2 4.7 6.2 22,441 -0.26 0.10 0.26 III
G42 新陆中75 Xinluzhong 75 29.1 84.0 31.6 5.1 3.6 23,141 0.81 0.32 0.59 I
G43 新陆中78 Xinluzhong 78 28.2 82.4 26.9 5.2 6.5 22,091 -0.91 0.16 0.06 III
代码
Code
品种
Cultivar name
LEN UNI STR MIC COL CPI CEI TCI FQI TYPE
G44 新陆中80 Xinluzhong 80 29.2 82.9 28.8 4.6 6.8 22,391 -0.15 0.17 0.30 III
G45 新陆中81 Xinluzhong 81 29.1 82.7 28.1 5.0 6.3 22,391 -0.28 0.10 0.26 III
G46 新陆中82 Xinluzhong 82 29.2 83.2 28.5 4.5 6.7 22,541 -0.10 0.17 0.32 III
G47 新陆中84 Xinluzhong 84 29.7 82.9 33.2 4.5 7.2 22,741 0.52 0.45 0.49 IV
G48 新陆中85 Xinluzhong 85 30.4 82.3 27.8 4.1 5.8 22,791 0.53 0.46 0.50 IV
G49 新陆中87 Xinluzhong 87 28.8 82.3 28.4 4.4 5.4 22,491 -0.11 0.12 0.31 II
G50 兆丰28 Zhaofeng 28 29.6 83.4 26.3 4.5 2.4 23,241 0.74 0.54 0.55 I
G51 中棉113 Zhongmian 113 30.4 83.9 33.4 4.6 6.9 23,091 1.05 0.53 0.64 IV
G52 中棉96A Zhongmian 96A 28.8 82.7 27.2 4.5 6.4 22,291 -0.35 0.15 0.24 III

图1

2019-2021年新疆棉花质量抽检棉花品种纤维性状的GT双标图 LEN: 纤维长度; UNI: 整齐度; STR: 比强度; MIC: 马克隆值; COL: 颜色级; CPI: 价格指数。大写字母G后面的数字为品种编号, 品种名称同表1。"

表2

2019-2021年新疆棉花质量抽检棉花品种纤维性状相关性分析"

性状 Trait LEN UNI STR MIC COL CPI
纤维长度Fiber length (LEN) 1
整齐度Fiber length uniformity (UNI) 0.613** 1
比强度Fiber strength (STR) 0.516** 0.519** 1
马克隆值Micronaire value (MIC) -0.247ns 0.038ns 0.033ns 1
颜色级Fiber color grade (COL) 0.005ns 0.086ns 0.074ns 0.156ns 1
价格指数Cotton price index (CPI) 0.616** 0.449** 0.497** -0.314* -0.681** 1

表3

纤维品质性状与价格指数逐步回归模型构建与验证"

模型
Model
标准回归系数 Standard regression coefficient 决定系数
R2
样本容量
Sample size
均方差根/均值
RMSE/$\bar{o}$(%)
LEN UNI STR MIC COL
模型1 Model 1 0.455 0.175 0.280 -0.116 -0.525 0.931** 7212 10.196
模型2 Model 2 0.453 0.172 0.284 -0.113 -0.529 0.932** 7212 10.108
模型3 Model 3 0.449 0.166 0.290 -0.118 -0.524 0.932** 7212 10.312
模型4 Model 4 0.456 0.180 0.279 -0.115 -0.524 0.933** 7212 10.169
模型5 Model 5 0.454 0.171 0.284 -0.115 -0.525 0.930** 7212 10.207
模型6 Model 6 0.454 0.170 0.287 -0.117 -0.525 0.931** 7211 10.294
模型7 Model 7 0.448 0.172 0.288 -0.118 -0.529 0.932** 7211 10.335
模型8 Model 8 0.448 0.171 0.291 -0.116 -0.525 0.931** 7211 10.184
模型9 Model 9 0.447 0.178 0.279 -0.119 -0.525 0.930** 7211 10.358
模型10 Model 10 0.446 0.172 0.290 -0.120 -0.528 0.932** 7211 10.401
平均值Mean 0.451 0.173 0.285 -0.117 -0.526 0.931** 7212 10.256

图2

棉花品种纤维性状WGT双标图的“均值-稳定性”功能图(a)和“理想品种”功能图(b) LEN: 纤维长度; UNI: 整齐度; STR: 比强度; MIC: 马克隆值; COL: 颜色级。大写字母G后面的数字为品种编号, 品种名称同表1。性状图标括号中的数据为权重, 如LEN (0.451)表示纤维长度的权重为0.451。PC1相当于综合评价指数(CEI), PC2的绝对值相当于性状协调指数(TCI)。图2-B中的同心圆圆心为理想品种坐标, 品种图标到圆心的欧氏距离表示离优度指数DTI, 距离越小则纤维质量指数越好。"

图3

棉花品种纤维性状WGT双标图的“品种聚类”功能图 椭圆形虚线所包围的品种为同一品种类型。I、II、III和IV表示品种类型。大写字母G后面的数字为品种编号, 品种名称同表1。性状缩写同图1。"

表4

基于WGT双标图分析的棉花质量抽检品种的纤维性状分类特征"

性状
Trait
I型品种
Variety type I
(mean ± SE)
II型品种
Variety type II
(mean ± SE)
III型品种
Variety type III
(mean ± SE)
IV型品种
Variety type IV
(mean ± SE)
纤维长度Fiber length (mm) 29.53±0.14 a 28.29±0.20 c 28.74±0.08 b 29.80±0.12 a
整齐度Fiber length uniformity (%) 83.28±0.25 a 82.03±0.24 c 82.72±0.14 b 83.43±0.22 a
比强度Fiber strength (cN tex-1) 29.60±0.70 a 27.99±0.27 b 28.38±0.15 b 30.81±0.60 a
马克隆值Micronaire value 4.68±0.09 ab 4.55±0.08 b 4.78±0.06 a 4.53±0.09 b
颜色级Fiber color grade 3.34±0.29 c 4.09±0.35 b 6.86±0.06 a 6.94±0.27 a
价格指数Cotton price index 23,116±82 a 22,624±47 b 22,312±36 c 22,747±56 b
综合评价指数Comprehensive evaluation index 0.83±0.15 a -0.16±0.08 c -0.44±0.06 d 0.42±0.11 b
性状协调指数Trait consistency index 0.36±0.04 a 0.38±0.08 a 0.19±0.01 b 0.38±0.04 a
纤维质量指数Fiber quality index 0.58±0.03 a 0.28±0.03 c 0.21±0.02 d 0.46±0.03 b
[1] 唐淑荣, 杨伟华. 我国主产棉省纤维品质现状分析与建议. 棉花学报, 2006, 18: 386-390.
Tang S R, Yang W H. Status and analysis of cotton fiber quality distribution in China and suggestions. Cotton Sci, 2006, 18: 386-390. (in Chinese with English abstract)
[2] 严威凯. 品种选育与评价的原理和方法评述. 作物学报, 2022, 48: 2137-2154.
doi: 10.3724/SP.J.1006.2022.11105
Yan W K. A critical review on the principles and procedures for cultivar development and evaluation. Acta Agron Sin, 2022, 48: 2137-2154. (in Chinese with English abstract)
doi: 10.3724/SP.J.1006.2022.11105
[3] Yan W K. A systematic narration of some key concepts and procedures in plant breeding. Front Plant Sci, 2021, 12: 724517.
doi: 10.3389/fpls.2021.724517
[4] Yan W K, Frégeau-Reid J. Genotype by yield × trait (GYT) biplot: a novel approach for genotype selection based on multiple traits. Sci Rep (UK), 2018, 8: 8242.
doi: 10.1038/s41598-018-26688-8
[5] Yan W K, Frégeau-Reid J. Breeding line selection based on multiple traits. Crop Sci, 2008, 48: 417-423.
doi: 10.2135/cropsci2007.05.0254
[6] Xu N Y, Fok M, Li J, Yang X N, Yan W K. Optimization of cotton variety registration criteria aided with a genotype-by-trait biplot analysis. Sci Rep (UK), 2017, 7: 17237.
doi: 10.1038/s41598-017-17631-4 pmid: 29222523
[7] Baxevanos D, Goulas C, Rossi J, Braojos E. Separation of cotton cultivar testing sites based on representativeness and discriminating ability using GGE biplots. Agron J, 2008, 100: 1230-1236.
doi: 10.2134/agronj2007.0363
[8] Blanche S B, Myers G O. Identifying discriminating locations for cultivar selection in Louisiana. Crop Sci, 2006, 46: 946-949.
doi: 10.2135/cropsci2005.0279
[9] 许乃银, 李健. 棉花区试中品种多性状选择的理想试验环境鉴别. 作物学报, 2014, 40: 1936-1945.
doi: 10.3724/SP.J.1006.2014.01936
Xu N Y, Li J. Identification of ideal test environments for multiple traits selection in cotton regional trials. Acta Agron Sin, 2014, 40: 1936-1945. (in Chinese with English abstract)
doi: 10.3724/SP.J.1006.2014.01936
[10] 严威凯. 双标图分析在农作物品种多点试验中的应用. 作物学报, 2010, 36: 1805-1819.
doi: 10.3724/SP.J.1006.2010.01805
Yan W K. Optimal use of biplots in analysis of multi-location variety test data. Acta Agron Sin, 2010, 36: 1805-1819. (in Chinese with English abstract)
[11] Yan W K. Crop Variety Trials:Data Management and Analysis. New York: John Wiley & Sons, 2014. pp 163-186.
[12] 许乃银, 赵素琴, 张芳, 付小琼, 杨晓妮, 乔银桃, 孙世贤. 基于GYT双标图对西北内陆棉区国审棉花品种的分类评价. 作物学报, 2021, 47: 660-671.
doi: 10.3724/SP.J.1006.2021.04135
Xu N Y, Zhao S Q, Zhang F, Fu X Q, Yang X N, Qiao Y T, Sun S X. Retrospective evaluation of cotton varieties nationally registered for the Northwest Inland cotton growing regions based on GYT biplot analysis. Acta Agron Sin, 2021, 47: 660-671. (in Chinese with English abstract)
doi: 10.3724/SP.J.1006.2021.04135
[13] Michele R, Nicola L, Zina F. Evaluation and application of the OILCROP-SUN model for sunflower in southern Italy. Agric Syst, 2003, 78: 17-30.
doi: 10.1016/S0308-521X(03)00030-1
[14] Yan W K, Kang M S, Ma B, Woods S, Cornelius P L. GGE biplot vs. AMMI analysis of genotype-by-environment data. Crop Sci, 2007, 47: 643-655.
doi: 10.2135/cropsci2006.06.0374
[15] Adugna W, Labuschagne M T. Cluster and canonical variate analyses in multilocation trials of linseed. J Agric Sci (Cambridge), 2003, 140: 297-304.
doi: 10.1017/S0021859603003174
[16] Robert L L, Michael P B, Stuart G G, Marinus H J, Geoffrey R S N, Greg A C. Fiber quality and textile performance of some Australian cotton genotypes. Crop Sci, 2010, 50: 1509-1518.
doi: 10.2135/cropsci2009.10.0600
[17] Yan W K. Singular-value partioning in biplot analysis of multienvironment trial data. Agron J, 2002, 94: 990-996.
[1] 岳海旺, 韩轩, 魏建伟, 郑书宏, 谢俊良, 陈淑萍, 彭海成, 卜俊周. 基于GYT双标图分析对黄淮海夏玉米区域试验品种综合评价[J]. 作物学报, 2023, 49(5): 1231-1248.
[2] 郭宏, 于霁雯, 裴文锋, 关永虎, 李航, 李长喜, 刘金伟, 王伟, 王宝全, 梅拥军. 南疆陆地棉杂种F2的遗传分析及遗传主效聚类[J]. 作物学报, 2023, 49(3): 608-621.
[3] 张以忠, 曾文艺, 邓琳琼, 张贺翠, 刘倩莹, 左同鸿, 谢琴琴, 胡燈科, 袁崇墨, 廉小平, 朱利泉. 甘蓝S-位点基因SRKSLGSP11/SCR密码子偏好性分析[J]. 作物学报, 2022, 48(5): 1152-1168.
[4] 赵文青, 徐文正, 杨锍琰, 刘玉, 周治国, 王友华. 棉花叶片响应高温的差异与夜间淀粉降解密切相关[J]. 作物学报, 2021, 47(9): 1680-1689.
[5] 许乃银, 赵素琴, 张芳, 付小琼, 杨晓妮, 乔银桃, 孙世贤. 基于GYT双标图对西北内陆棉区国审棉花品种的分类评价[J]. 作物学报, 2021, 47(4): 660-671.
[6] 张贵合,郭华春. 马铃薯不同品种(系)的光合特性比较与聚类分析[J]. 作物学报, 2017, 43(07): 1067-1076.
[7] 王瑞云,季煦,陆平,刘敏轩,许月,王纶,王海岗,乔治军. 利用荧光SSR分析中国糜子遗传多样性[J]. 作物学报, 2017, 43(04): 530-548.
[8] 胡一波,杨修仕,陆平*,任贵兴*. 中国北部藜麦品质性状的多样性和相关性分析[J]. 作物学报, 2017, 43(03): 464-470.
[9] 徐宁,陈冰嬬,王明海,包淑英,王桂芳,郭中校. 绿豆品种资源萌发期耐碱性鉴定[J]. 作物学报, 2017, 43(01): 112-121.
[10] 吴奇,周宇飞,高悦,张姣,陈冰嬬,许文娟,黄瑞冬. 不同高粱品种萌发期抗旱性筛选与鉴定[J]. 作物学报, 2016, 42(08): 1233-1246.
[11] 刘颖,张巧凤,付必胜,蔡士宾,蒋彦婕,张志良,邓渊钰,吴纪中,戴廷波. 小麦纹枯病抗源的遗传多样性及抗性基因位点SSR标记分析[J]. 作物学报, 2015, 41(11): 1671-1681.
[12] 李龙,王兰芬,武晶,景蕊莲,王述民. 普通菜豆品种苗期抗旱性鉴定[J]. 作物学报, 2015, 41(06): 963-971.
[13] 姜朋,陈小霖,张平平,张鹏,姚金保,马鸿翔. 宁麦9号对其衍生品种的遗传贡献[J]. 作物学报, 2014, 40(05): 830-837.
[14] 范伟,李雪姣,关明俐,缪刘杨,史佳楠,窦世娟,刘丽娟,李莉云,刘国振. 水稻几丁质酶基因的转录与表达特征[J]. 作物学报, 2014, 40(04): 571-580.
[15] 王艺陶,周宇飞,李丰先,依兵,白薇,闫彤,许文娟,高明超,黄瑞冬. 基于主成分和SOM聚类分析的高粱品种萌发期抗旱性鉴定与分类[J]. 作物学报, 2014, 40(01): 110-121.
Viewed
Full text


Abstract

Cited

  Shared   
  Discussed   
[1] 李绍清, 李阳生, 吴福顺, 廖江林, 李达模. 水稻孕穗期在淹涝胁迫下施肥的优化选择及其作用机理[J]. 作物学报, 2002, 28(01): 115 -120 .
[2] 王兰珍;米国华;陈范骏;张福锁. 不同产量结构小麦品种对缺磷反应的分析[J]. 作物学报, 2003, 29(06): 867 -870 .
[3] 杨建昌;张亚洁;张建华;王志琴;朱庆森. 水分胁迫下水稻剑叶中多胺含量的变化及其与抗旱性的关系[J]. 作物学报, 2004, 30(11): 1069 -1075 .
[4] 袁美;杨光圣;傅廷栋;严红艳. 甘蓝型油菜生态型细胞质雄性不育两用系的研究Ⅲ. 8-8112AB的温度敏感性及其遗传[J]. 作物学报, 2003, 29(03): 330 -335 .
[5] 王永胜;王景;段静雅;王金发;刘良式. 水稻极度分蘖突变体的分离和遗传学初步研究[J]. 作物学报, 2002, 28(02): 235 -239 .
[6] 王丽燕;赵可夫. 玉米幼苗对盐胁迫的生理响应[J]. 作物学报, 2005, 31(02): 264 -268 .
[7] 田孟良;黄玉碧;谭功燮;刘永建;荣廷昭. 西南糯玉米地方品种waxy基因序列多态性分析[J]. 作物学报, 2008, 34(05): 729 -736 .
[8] 胡希远;李建平;宋喜芳. 空间统计分析在作物育种品系选择中的效果[J]. 作物学报, 2008, 34(03): 412 -417 .
[9] 王艳;邱立明;谢文娟;黄薇;叶锋;张富春;马纪. 昆虫抗冻蛋白基因转化烟草的抗寒性[J]. 作物学报, 2008, 34(03): 397 -402 .
[10] 郑希;吴建国;楼向阳;徐海明;石春海. 不同环境条件下稻米组氨酸和精氨酸的胚乳和母体植株QTL分析[J]. 作物学报, 2008, 34(03): 369 -375 .