Welcome to Acta Agronomica Sinica,

Acta Agronomica Sinica ›› 2026, Vol. 52 ›› Issue (5): 1309-1325.doi: 10.3724/SP.J.1006.2026.53083

• CROP GENETICS & BREEDING·GERMPLASM RESOURCES·MOLECULAR GENETICS • Previous Articles     Next Articles

Phenotypic evaluation and plasticity analysis of drought resistance in 201 maize inbred lines

Zhang Ning-Ning1,2(), Teng Yu-Fei1, Ren Na-Na2, Wei Xing-Zhuo1, Yan Shu-Hao1, Fan Ke-Xin1, Wang Yong-Hong2, Chen Wen-Kang1, Zhang Xing-Hua1, Zhu Wan-Chao1, Xu Shu-Tu1,*(), Xue Ji-Quan1,*()   

  1. 1 College of Agronomy, Northwest A&F University, Yangling 712100, Shaanxi, China
    2 Crop Research Institute of Ningxia Academy of Agriculture and Forestry Sciences, Yinchuan 750011, Ningxia, China
  • Received:2025-10-27 Accepted:2026-02-27 Online:2026-05-12 Published:2026-03-11
  • Contact: *Xue Ji-Quan, E-mail: xjq2934@163.com; Xu Shu-Tu, E-mail: shutuxu@nwafu.edu.cn
  • Supported by:
    Central Government’s Guidance Funds for Local Areas Project of Shaanxi Province(2024ZY-CGZY-17);Key Core Technology Research Project of Shaanxi Province(2024NYGG001);National Key R&D Program of China during the 13th Five-Year Plan Period(2018YFD0100200)

Abstract:

Drought is the primary constraint limiting maize yield improvement. Phenotypic plasticity describes how a given genotype responds to environmental variation; therefore, evaluating drought plasticity in maize inbred lines is essential. Using drought-resistance-related data for 201 inbred lines evaluated across five environments and two water regimes during 2019-2020, we assessed drought resistance using three approaches, including factor analysis, and classified the lines into four levels: highly resistant (HR), resistant (R), moderately resistant (MR), and weakly resistant (WR). Lines such as KA105, KB020, and Zong 31 showed strong drought resistance. Plasticity was then quantified using the Finlay-Wilkinson (FW) regression, and two drought plasticity patterns were defined: G×E positive plasticity (a genotype shows a significantly better positive response than its overall mean performance in specific environments) and no G×E positive plasticity (a genotype performs stably across environments and does not show a significantly better positive response relative to its overall mean in any environment). KA105 and M1801 were classified as the G×E positive plasticity type, whereas 09B-6-2 was classified as the no G×E positive plasticity type. Overall, KA105 combined strong drought resistance with G×E positive plasticity, indicating that it is a promising germplasm source for drought-resistance breeding with potential for broad application.

Key words: maize, KA105, genotype×environment interaction (G×E), drought resistant plasticity, yield

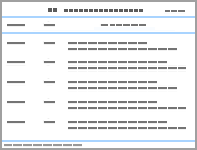
Table 1

Names and corresponding serial numbers of 201 maize inbred lines"

编号
No.
自交系
Inbred line
编号
No.
自交系
Inbred line
编号
No.
自交系
Inbred line
编号
No.
自交系
Inbred line
编号
No.
自交系
Inbred line
1 09B-6-2 42 DH164-13 84 HS200 126 LYA81 168 WB10
2 11430 43 DH164-22 85 IBB14 127 LYB1831 169 WK858
3 137 44 DH165-4 86 ICI193 128 LYB29 170 XF68F
4 1408 45 DH169-3 87 ICI441 129 LYB70 171 XP3M
5 1475 46 DH218-9 88 ICI740 130 LYB92 172 Y06088
6 1503M 47 DH230-2 89 JH089 131 M1608 173 Y3011
7 1601 48 DH244-4 90 JH14251 132 M1801 174 YCZ17188
8 18KA14 49 DH259 91 JH49 133 M2902 175 YCZ1862
9 31778 50 DH3805 92 JL133 134 Mo17 176 YCZ1995
10 328M 51 DH448-5 93 JL230 135 NW/H537 177 YN3M
11 35S 52 DH469-4 94 JSHj94 136 P138 178 昌7-2 Chang 7-2
12 445 53 DH493-16 95 K10-140 137 PH4CV 179 京045 Jing 045
13 641 54 DH493-40 96 K10-96 138 PH6WC 180 京1472 Jing 1472
14 798-1 55 DH498-3 97 K12 139 PHJ89 181 京17 Jing 17
15 91227 56 DH509-9 98 K6 140 PHK42 182 京183 Jing 183
16 A4308 57 DH511-5 99 KA064 141 PHM49 183 京MT028 Jing MT028
17 C102 58 DH527-6 100 KA103 142 PHP85 184 ly0996
18 C113 59 DH564-15 101 KA105 143 PHPR5 185 ly8112
19 C141 60 DH567-1 102 KA115 144 PHR32 187 武9086 Wu 9086
20 C144 61 DH574-2 103 KA203 146 PHW52 188 新自3113 Xz3113
21 C145 63 DH604-17 105 KB020 147 PL101 189 新自5172 Xz5172
22 C39 64 DH679-10 106 KB081 148 RP06 190 新自5426 Xz5426
23 C40 65 DH775-13 107 KB089 149 沈137 Shen 137 191 新自6106 Xz6106
24 C50 66 DH783-11 108 KB102 150 W101 192 新自6177 Xz6177
25 C57 67 DH814-3-1 109 KB106 151 W106 193 新自618 Xz618
26 C71 68 DHB10Z5 110 KB182 152 W108 194 新自6423 Xz6423
27 C77 69 DHFKM9 111 KB207 153 W112 195 新自6453 Xz6453
28 C78 70 DHJ026-12 112 KH11-26 154 W120 196 新自6812 Xz6812
29 C93 71 DHJ030-11 113 KH1126 155 W15A 197 新自6845 Xz6845
30 Chang 7-2-1g 72 DF 114 KH128 156 W1901 198 新自7523 Xz7523
31 长S25 Chang S25 73 DM 115 KH980 157 W1902 199 郑58 Zheng 58
32 D121 74 F118 116 KY1M9 158 W414 200 自330 Zi 330
33 D201 75 F124 117 L314SL 159 W458 201 综31 Zong 31
34 DA1810 76 F141 118 L61F 160 W5387
35 DD1812 77 F3105 119 LF1011 161 W597
36 DH038-1-2 78 F7201 120 LH149 162 W72
37 DH060-8 79 FH1819 121 LM1305 163 W73
38 DH068-1 80 H159 122 LM1607 164 W74
39 DH103-3 81 H305 123 LYA1871 165 W75
40 DH129-3 82 H477 124 LYA49 166 W88
41 DH133-1 83 H901 125 LYA52 167 WA07

Table 2

Names and definitions of yield and other traits"

性状
Trait
定义
Definition
籽粒产量Grain yield (GY, kg) 单位面积玉米籽粒的总重量 Total weight of kernels per unit area
穗重Ear weight (EW, kg) 10个代表性果穗的总重量 Total weight of ten representative ears
单穗粒重Grain yield per plant (GYP, kg) 1个代表性果穗的总重量 Total weight of one representative ear
穗长Ear length (EL, cm) 果穗纵向最长的距离 Longest longitudinal distance of the ear
行粒数Kernel number per row (KNR) 果穗上每行籽粒的平均数量 Average number of grains per row on the ear
株高Plant height (PH, cm) 从地面到植株最高点的垂直距离
Vertical distance from the ground to the highest point of the plant
穗位高Ear height (EH, cm) 从地面到植株上第一个果穗着生节的垂直距离
Vertical distance from the ground to the node bearing the first ear on the plant
散粉期Days to anthesis (DTA, d) 播种至小区有50%的植株雄穗吐出的天数
Number of days from sowing to 50% tassel emergence in a plot
吐丝期Days to silking (DTS, d) 播种至小区有50%的植株雌穗散粉的天数
Number of days from sowing to 50% silking in a plot
散粉吐丝间隔期Anthesis-silking interval (ASI, d) 雄穗开始散粉到雌穗顶部花丝开始吐出之间的时间差
Time interval between tassel pollen shedding initiation and silk emergence from the ear tip

Fig. 1

BLUP performance of each trait under well-watered and drought-stress conditions in 2019 and 2020 Abbreviations are the same as those given in Table 2. ** and *** indicate significant differences at P < 0.01 and P < 0.001, respectively; ns, no significant difference. WW and DS indicate well-watered and drought-stress treatments, respectively. BLUP: best linear unbiased prediction."

Table 3

Descriptive statistics of BLUP values for each trait under different water treatments"

处理
Treatment
统计量
Statistic
籽粒产量
GY (kg)
单穗粒重
GYP (kg)
穗重
EW (kg)
穗长
EL (cm)
行粒数
KNR
2019WW Mean ± SD 424.99±127.78 0.14±0.08 0.14±0.06 15.61±2.01 28.13±4.40
CV (%) 30.08 58.30 41.15 12.91 15.66
Range 83.00-882.79 0.02-0.59 0.03-0.40 4.50-23.37 0.10-43.20
Kurt -0.43 2.93 0.31 1.50 2.24
Skew 0.32 -0.09 -0.41 0.28 -0.03
2019DS Mean ± SD 297.65±127.12 0.09±0.05 0.11±0.05 14.03±1.96 26.10±4.05
CV (%) 42.71 54.06 44.18 13.95 15.53
Range 23.02-744.19 0-0.34 0.01-0.28 8.00-22.80 11.60-41.00
Kurt -0.13 0.07 -0.17 0.34 1.32
Skew -0.12 -0.09 0.20 0.13 -0.14
2020WW Mean ± SD 414.01±112.69 0.10±0.03 0.13±0.04 4.27±0.39 27.66±5.19
CV (%) 27.22 29.59 30.41 9.21 18.75
Range 27.85-687.56 0.03-0.23 0.04-0.32 1.80-5.60 7.40-44.20
Kurt -0.47 0.09 0.14 0.92 0.01
Skew 2.66 0.16 0.32 0.01 0.14
2020DS Mean ± SD 313.55±104.21 0.08±0.03 0.11±0.03 13.41±1.89 24.12±5.05
CV (%) 33.25 34.71 31.16 14.09 20.94
Range 36.34-606.94 0.01-0.19 0.02-0.24 6.80-21.60 6.13-39.00
Kurt -0.33 -0.12 -0.16 3.44 -0.01
Skew 0.05 0.21 0.20 -0.35 -0.33
处理
Treatment
统计量
Statistic
散粉期
DTA (d)
吐丝期
DTS (d)
散粉吐丝间隔期
ASI (d)
株高
PH (cm)
穗位高
EH (cm)
2019WW Mean ± SD 70.67±5.67 71.21±6.07 1.61±1.60 207.34±37.50 73.03±17.74
CV (%) 8.03 8.54 99.65 18.09 24.31
Range 54.00-84.00 54.00-84.00 0-9.00 94.67-315.60 32.33-134.55
Kurt 0.47 0.08 0.70 -0.21 0.49
Skew -0.64 -0.18 0.90 0.03 0.49
2019DS Mean ± SD 71.40±5.51 72.62±5.98 2.15±1.92 175.33±36.75 65.04±16.60
CV (%) 7.72 8.23 89.29 20.96 25.52
Range 54.00-82.00 55.00-88.00 0-10.00 68.17-262.73 22.33-126.00
Kurt -0.28 -0.79 -0.42 -0.55 0.20
Skew -0.65 -0.07 0.17 0.05 0.45
2020WW Mean ± SD 78.81±9.71 78.39±9.28 1.68±1.79 206.45±28.68 71.93±15.75
CV (%) 12.33 11.84 106.71 13.89 21.90
Range 50.00-96.00 50.00-97.00 0-10.00 107.20-288.70 22.60-120.70
Kurt 0.42 0.76 2.78 -0.10 -0.19
Skew 0.26 0.24 0.05 0.68 0.37
2020DS Mean ± SD 82.08±5.91 82.85±5.89 1.20±1.55 184.58±30.75 64.82±14.86
CV (%) 7.20 7.11 129.34 16.66 22.93
Range 51.00-105.00 50.00-97.00 0-9.00 88.00-673.67 14.67-120.70
Kurt 1.25 0.99 1.96 -0.14 0.37
Skew -0.43 -0.49 5.52 2.31 0.32

Fig. 2

Screening of drought-resistance indicators and analysis of secondary traits Abbreviations are the same as those given in Table 2. A: PC1 and PC2 explain 46.97% and 27.29% of the total phenotypic variation, respectively. Vectors represent individual indicators, and their lengths and directions reflect correlations with the two principal components; B: loading values of different traits across five factors, showing the associations between drought resistance and multiple traits; the color gradient from red to blue indicates decreasing association. BLIP: best linear unbiased prediction; WWBLUP and DSBLUP represent the BLUP values for yield under well water and drought stress conditions, respectively; STI: stress tolerance index; SSI: stress susceptibility index; TOL: tolerance index; MP: mean productivity; DRC: drought resistance coefficient; GMP: geometric mean productivity; DRI: drought resistance index."

Table 4

Varimax orthogonal rotated factor loading"

性状 Trait 因子1 Factor 1 因子2 Factor 2 因子3 Factor 3 因子4 Factor 4 因子5 Factor 5
GYP 0.81 0.16 0.31 -0.06 0.05
EW 0.74 0.20 0.28 -0.07 -0.05
EL 0.84 -0.07 -0.22 -0.13 0.06
KNR 0.80 -0.24 -0.05 0.16 -0.01
ASI 0.09 -0.02 -0.03 0.98 -0.02
DTA 0.03 0.95 0.10 -0.12 0.06
DTS -0.02 0.95 0.15 0.03 -0.04
EH 0.10 0.18 0.94 0.03 0.01
PH 0.03 0.02 0.01 -0.02 0.99

Fig. 3

Classification of drought-resistance levels for 201 inbred lines HR: highly resistant; R: resistant; MR: moderately resistant; WR: weakly resistant."

Fig. 4

Changes in GEI effect values of the drought-resistance index across genotypes A: Heatmap of GEI effect values for genotypes in different drought-resistance classes. E1-E5 on the y-axis indicate the five environments, and genotype IDs are shown on the x-axis. Color intensity reflects the absolute magnitude of GEI effects, with darker colors (eg, deep purple or deep blue) indicating stronger genotype×environment interaction in that environment. B: trends in GEI effect values across environments for different drought-resistance classes. HR: highly resistant; R: resistant; MR: moderately resistant; WR: weakly resistant. E1: Yulin city, Shaanxi province; E2: Yinchuan city, Ningxia Hui Autonomous Region; E3: Taiyuan city, Shanxi province; E4: Zhangye city, Gansu province; E5: Urumqi city, Xinjiang Uygur Autonomous Region. GEI: genotype×environment interaction."

Fig. 5

Plasticity patterns and magnitudes of yield under WW, DS, and the drought-resistance index in 201 inbred lines A: plasticity patterns of grain yield (GY) under WW; B: plasticity patterns of GY under DS; C: plasticity patterns of DRI; D: plasticity of genotypes after ranking environmental gradients for GY under WW; E: plasticity of genotypes after ranking environmental gradients for GY under DS; F: plasticity of genotypes after ranking environmental gradients for DRI. DRI, drought-resistance index. Abbreviations are the same as those given in Table 2 and Fig. 4. Treatments are the same as those given in Fig. 1."

Fig. 6

Trends in yield plasticity across drought-tolerance classes under WW and DS A: plasticity magnitude of HR genotypes under WW and DS; B: plasticity magnitude of R genotypes under WW and DS; C: plasticity magnitude of MR genotypes under WW and DS; D: plasticity magnitude of WR genotypes under WW and DS; E: percentage of genotypes showing increased plasticity under DS in each drought-tolerance class; F: trends in plasticity from WW to DS across drought-tolerance classes. **, P < 0.01; ***, P < 0.001. Abbreviations are the same as those given in Fig. 3. Treatments are the same as those given in Fig. 1."

Fig. 7

Patterns of plasticity and genotype×environment interaction A: neither GEI nor plasticity; B: plasticity without GEI; C-D: both plasticity and GEI; E: plasticity of LYA81, 09B-6-2, KY1M9, and M1801 under WW and DS. Abbreviations are the same as those given in Fig. 3 and Fig. 4. Treatments are the same as those given in Fig. 1."

Fig. 8

Plasticity of grain yield and drought-resistance index in 201 inbred lines under WW and DS A: yield and plasticity under WW; B: yield and plasticity under DS; C: plasticity of DRI based on yield; D: genotypes showing high plasticity for both yield and DRI under WW and DS. DRI, drought-resistance index. Abbreviations are the same as those given in Table 2. Treatments are the same as those given in Fig. 1."

Fig. 9

Quartile dispersion coefficients of plasticity for 10 traits A: plasticity of 10 traits under WW and DS; B: plasticity of the drought-resistance index for 10 traits; C: plasticity of the drought-resistance index for 10 traits in genotypes from different drought-tolerance classes. Abbreviations are the same as those given in Table 2 and Fig. 3. Treatments are the same as those given in Fig. 1."

[1] Daryanto S, Wang L X, Jacinthe P A. Global synthesis of drought effects on maize and wheat production. PLoS One, 2016, 11: e0156362.
[2] Gupta A, Rico-Medina A, Caño-Delgado A I. The physiology of plant responses to drought. Science, 2020, 368: 266-269.
doi: 10.1126/science.aaz7614 pmid: 32299946
[3] 王崇桃, 李少昆. 玉米生产限制因素评估与技术优先序. 中国农业科学, 2010, 43: 1136-1146.
doi: 10.3864/j.issn.0578-1752.2010.06.005
Wang C T, Li S K. Assessment of limiting factors and techniques prioritization for maize production in China. Sci Agric Sin, 2010, 43: 1136-1146 (in Chinese with English abstract).
[4] Sandhu N, Raman K A, Torres R O, et al. Rice root architectural plasticity traits and genetic regions for adaptability to variable cultivation and stress conditions. Plant Physiol, 2016, 171: 2562-2576.
doi: 10.1104/pp.16.00705 pmid: 27342311
[5] 刘成, 石云素, 宋燕春, 等. 玉米种质资源抗旱性的田间鉴定与评价. 新疆农业科学, 2007, 44: 545-548.
Liu C, Shi Y S, Song Y C, et al. Determination and evaluation of drought resistance of germplasm resources of maize in field. Xinjiang Agric Sci, 2007, 44: 545-548 (in Chinese with English abstract).
[6] Crews D. Sex determination: where environment and genetics meet. Evol Dev, 2003, 5: 50-55.
pmid: 12492409
[7] Rehfeldt G E, Wykoff W R, Ying C C. Physiologic plasticity, evolution, and impacts of a changing climate on Pinus contorta. Clim Change, 2001, 50: 355-376.
doi: 10.1023/A:1010614216256
[8] Callaway R M, Pennings S C, Richards C L. Phenotypic plasticity and interactions among plants. Ecology, 2003, 84: 1115-1128.
doi: 10.1890/0012-9658(2003)084[1115:PPAIAP]2.0.CO;2
[9] Donohue K. Development in the wild: phenotypic plasticity. Ann Plant Rev, 2013, 45: 321-355.
[10] Des Marais D L, Hernandez K M, Juenger T E. Genotype-by-environment interaction and plasticity: exploring genomic responses of plants to the abiotic environment. Annu Rev Ecol Evol Syst, 2013, 44: 5-29.
doi: 10.1146/ecolsys.2013.44.issue-1
[11] Kusmec A, de Leon N, Schnable P S. Harnessing phenotypic plasticity to improve maize yields. Front Plant Sci, 2018, 9: 1377.
doi: 10.3389/fpls.2018.01377 pmid: 30283485
[12] Ort D R, Merchant S S, Alric J, et al. Redesigning photosynthesis to sustainably meet global food and bioenergy demand. Proc Natl Acad Sci USA, 2015, 112: 8529-8536.
doi: 10.1073/pnas.1424031112 pmid: 26124102
[13] Tian J G, Wang C L, Chen F Y, et al. Maize smart-canopy architecture enhances yield at high densities. Nature, 2024, 632: 576-584.
doi: 10.1038/s41586-024-07669-6
[14] Tian T, Wang S H, Yang S P, et al. Genome assembly and genetic dissection of a prominent drought-resistant maize germplasm. Nat Genet, 2023, 55: 496-506.
doi: 10.1038/s41588-023-01297-y pmid: 36806841
[15] Wang X L, Wang H W, Liu S X, et al. Genetic variation in ZmVPP1 contributes to drought tolerance in maize seedlings. Nat Genet, 2016, 48: 1233-1241.
doi: 10.1038/ng.3636 pmid: 27526320
[16] Nicotra A B, Atkin O K, Bonser S P, et al. Plant phenotypic plasticity in a changing climate. Trends Plant Sci, 2010, 15: 684-692.
doi: 10.1016/j.tplants.2010.09.008 pmid: 20970368
[17] 李忠南, 车丽梅, 王越人, 等. 玉米主要穗性状GCA和SCA效应值的因子分析. 农业科技通讯, 2021(10): 46-50.
Li Z N, Che L M, Wang Y R, et al. Factor analysis of the effect values of GCA and SCA for the main ear traits of maize. Bull Agric Sci Technol, 2021(10): 46-50 (in Chinese).
[30] Lin C S, Binns M R. A method of analyzing cultivar × location × year experiments: a new stability parameter. Theor Appl Genet, 1988, 76: 425-430.
doi: 10.1007/BF00265344 pmid: 24232208
[31] Arnold P A, Kruuk L E B, Nicotra A B. How to analyse plant phenotypic plasticity in response to a changing climate. New Phytol, 2019, 222: 1235-1241.
doi: 10.1111/nph.15656 pmid: 30632169
[32] Laitinen R A E, Nikoloski Z. Genetic basis of plasticity in plants. J Exp Bot, 2019, 70: 739-745.
doi: 10.1093/jxb/ery404 pmid: 30445526
[33] 袁邦义, 郭家禹, 蒋飞. 玉米籽粒直收新品种迪卡517的特征特性及高产栽培技术. 现代农业科技, 2019(5): 28.
Yuan B Y, Guo J Y, Jiang F. Characteristics and high-yield cultivation techniques of the new maize grain direct harvest variety DK517. XianDai NongYe KeJi, 2019(5): 28 (in Chinese).
[34] 鲁宝良, 赵文媛, 刘日尊, 等. Mo17衍生系组配杂交种对我国玉米生产的影响和贡献. 玉米科学, 2004, 12(增刊1): 127-128.
Lu B L, Zhao W Y, Liu R Z, et al. The influence and contribution of the hybrids crossed by Mo17 deriving self inbred lines to the production of China. J Maize Sci, 2004, 12(S1): 127-128 (in Chinese with English abstract).
[35] Juenger T E. Natural variation and genetic constraints on drought tolerance. Curr Opin Plant Biol, 2013, 16: 274-281.
doi: 10.1016/j.pbi.2013.02.001 pmid: 23462639
[36] Copeland S M, Harrison S P, Latimer A M, et al. Ecological effects of extreme drought on Californian herbaceous plant communities. Ecol Monogr, 2016, 86: 295-311.
doi: 10.1002/ecm.1218
[18] 王苏湘, 游健强, 史家朋. 基于因子分析法的河南省玉米产业发展影响因素研究. 粮食科技与经济, 2022, 47(3): 38-40.
Wang S X, You J Q, Shi J P. Research on the influencing factors of corn industry development in Henan province based on factor analysis. Food Sci Technol Econ, 2022, 47(3): 38-40 (in Chinese with English abstract).
[19] Lafitte H R, Edmeades G O. Improvement for tolerance to low soil nitrogen in tropical maize I. Selection criteria. Field Crops Res, 1994, 39: 1-14.
doi: 10.1016/0378-4290(94)90066-3
[20] Cooper M, Podlich D W, Fukai S. Combining information from multi-environment trials and molecular markers to select adaptive traits for yield improvement of rice in water-limited environments. Stem Cells Dev, 1999, 22:1097-1111.
doi: 10.1089/scd.2012.0432
[21] Forde B G. Is it good noise? The role of developmental instability in the shaping of a root system. J Exp Bot, 2009, 60: 3989-4002.
doi: 10.1093/jxb/erp265 pmid: 19759097
[22] Bates D, Mächler M, Bolker B, et al. Fitting linear mixed-effects models Usinglme4. J Stat Soft, 2015, 67:1-48.
[23] Rosielle A A, Hamblin J. Theoretical aspects of selection for yield in stress and non-stress environment. Crop Sci, 1981, 21: 943-946.
doi: 10.2135/cropsci1981.0011183X002100060033x
[24] Chinoy J J. Physiology of drought resistance in wheat. Phyton, 1962, 19(1): 5-20.
[25] Fischer R A, Maurer R. Drought resistance in spring wheat cultivars. I. Grain yield responses. Aust J Agric Res, 1978, 29: 897-912.
doi: 10.1071/AR9780897
[26] 丰光, 赵洪绪, 王孝杰, 等. 玉米自交系郑58×PH6WC二环选系的配合力研究. 玉米科学, 2021, 29(5): 22-27.
Feng G, Zhao H X, Wang X J, et al. Study on combining ability of second cycle inbred lines in maize inbred line Zheng 58×PH6WC. J Maize Sci, 2021, 29(5): 22-27 (in Chinese with English abstract).
[27] 兰巨生, 胡福顺, 张景瑞. 作物抗旱指数的概念和统计方法. 华北农学报, 1990, 5(2): 20-25.
doi: 10.3321/j.issn:1000-7091.1990.02.004
Lan J S, Hu F S, Zhang J R. The concept and statistical method of drought resistance index in crops. Acta Agric Boreali-Sin, 1990, 5(2): 20-25 (in Chinese with English abstract).
doi: 10.3321/j.issn:1000-7091.1990.02.004
[28] Lian L, de los Campos G. FW: an R package for Finlay-Wilkinson regression that incorporates genomic/pedigree information and covariance structures between environments. G3: Gene Genom Genet, 2016, 6: 589-597.
[29] Finlay K W, Wilkinson G N. The analysis of adaptation in a plant-breeding programme. Aust J Agric Res, 1963, 14: 742-754.
doi: 10.1071/AR9630742
[1] Hu Chuan, Zhao Kai-Nan, Huang Xiu-Li, Wu Jin-Zhi, Ren Kai-Ming, Wang He-Zheng, Fu Guo-Zhan, Huang Ming, Li You-Jun. Effects of tillage methods and nitrogen rates on yield and quality of dryland wheat under one-off irrigation [J]. Acta Agronomica Sinica, 2026, 52(6): 1830-1846.
[2] Liang Jin-Yu, Yin Jia-De, Wang Hong-Li, Zhang Guo-Ping, Hou Hui-Zhi, Dong Bo, Ma Ming-Sheng. Estimation of leaf nitrogen content in dryland forage maize using UAV-based hyperspectral imaging and machine learning [J]. Acta Agronomica Sinica, 2026, 52(6): 1788-1801.
[3] Ma Sheng-Qian, Wang Zhi-Ping, Chen Hao-Tian, Dou Shu-Xian, Zhang Yan, Deng Ai-Xing, Zhang Wei-Jian, Yuan Xiang-Yang, Song Zhen-Wei. Effects of tillage methods and nitrogen application rate on maize yield and soil aggregates in northeastern China under straw returning [J]. Acta Agronomica Sinica, 2026, 52(6): 1802-1816.
[4] Sun Shu-Feng, Xu Zhen-Nan, Huang Jia-Xin, Weng Jian-Feng, Li Xin-Hai. Genome-wide identification of the maize MAPK gene family and its response to Fusarium verticillioides infection [J]. Acta Agronomica Sinica, 2026, 52(5): 1291-1308.
[5] Zhang Si-Si, Zhao Xiang-Hui, Zhou Yang, Yao Yun-Feng, Zhu Rong-Yu, Dong Yuan-Jie, Hu Guo-Qing, Xu Tong, Liu Zhao-Xin. Effects of plowing and green manure returning in winter fallow period on soil physicochemical properties and yield in continuously cropped peanut [J]. Acta Agronomica Sinica, 2026, 52(5): 1472-1486.
[6] Wang Yu-Cheng, Zhang Lu, Liu A-Kang, Huang Jian-Liang, Peng Shao-Bing, Yuan Shen. Strategies and prospects for large-scale crop yield improvement based on yield gap [J]. Acta Agronomica Sinica, 2026, 52(5): 1279-1290.
[7] Yang Xin-Yu, Cui Wen-Tao, Dilinigeer Alimu, Wang Kai-Xiang, Wu Peng-Hao, Ren Jiao-Jiao. Genome-wide association and genomic selection analysis of the number of leaves above the ear in maize [J]. Acta Agronomica Sinica, 2026, 52(5): 1573-1590.
[8] Han Ya-Xin, He Guan-Hua, Zhang Xiao-Qiong, Zhang Deng-Feng, Li Yong-Xiang, Liu Xu-Yang, Wang Tian-Yu, Li Yu, Zou Hua-Wen, Li Chun-Hui. Identification of maize lateral root density genes resources through integrated RNA-seq and BSA-seq analyses [J]. Acta Agronomica Sinica, 2026, 52(5): 1341-1352.
[9] Zhang Zhen, Feng Lian-Jie, Shi Yu, Yu Zhen-Wen, Zhang Yong-Li. Yield formation of wheat with different ear types under water-saving supplementary irrigation conditions [J]. Acta Agronomica Sinica, 2026, 52(5): 1522-1535.
[10] Yan An, Jiang Kun-Wei, Wang Rong-Yuan, Tian Lin, Zhang Lu, Wang Yun, Xu Jian-Long. Identification and cloning of SVN7 controlling small vascular bundle number in the rice flag leaf [J]. Acta Agronomica Sinica, 2026, 52(5): 1364-1372.
[11] Liu Xin-Meng, Ren Hao, Zhang Ji-Bo, Zhang Ji-Wang, Zhao Bin, Ren Bai-Zhao, Liu Peng, Wang Hong-Zhang. Physiological mechanisms of methyl jasmonate (MeJA) alleviating the effects of heat stress on ear differentiation in maize [J]. Acta Agronomica Sinica, 2026, 52(5): 1561-1572.
[12] Wang Zhuang-Zhuang, Wu Zi-Jun, Zhang Yong-Xin, Zhang Xin-Yuan, Yuan Li-Xue, Chen Ru-Xue, Liu Shi-Ju, Duan Jian-Zhao, Feng Wei, Wang Tong-Chao, Wang Yong-Hua. Optimized water-nitrogen synergy enhances winter wheat yield and nitrogen use efficiency in clay-loam fluvo-aquic soils of southeastern Henan, China [J]. Acta Agronomica Sinica, 2026, 52(5): 1501-1521.
[13] Zhao Jia-Xue, Zhou Long-Hao, Guo Qi-Yuan, Shang Lun-Xiao, Wang Han, Liu Zhi-Tao, Chen Xi, Zhang Xiao-Pei, Song Xian-Liang, Ahmedov Miraziz Baltaevich, Mao Li-Li. Long-term stubble return and subsoiling enhance cotton yields in coastal saline-alkali soils by improving soil conditions and photosynthetic characteristics [J]. Acta Agronomica Sinica, 2026, 52(5): 1548-1560.
[14] Yang Yang, Chang Shi-Hui, Tian Hong-Li, Yi Hong-Mei, Wang Lu, Ren Jie, Fan Ya-Ming, Liu Ya-Wei, Wang Feng-Ge, Zhao Jiu-Ran. Genetic diversity analysis of nationally approved maize varieties in different ecological regions [J]. Acta Agronomica Sinica, 2026, 52(5): 1352-1364.
[15] Guo Xing-Yu, Hu Dan, Lin Su-Qi, Wang Meng-Kai, Tan Wen-Feng, Huang Chuan-Qin. Biochar combined with chemical fertilizer increases maize yield and soil ecosystem multifunctionality in an intercropped maize-soybean [J]. Acta Agronomica Sinica, 2026, 52(5): 1536-1547.
Viewed
Full text


Abstract

Cited

  Shared   
  Discussed   
No Suggested Reading articles found!