欢迎访问作物学报,今天是
作物学报 ›› 2022, Vol. 48 ›› Issue (9): 2285-2299.doi: 10.3724/SP.J.1006.2022.12070
周群1,2( ), 袁锐1,2, 朱宽宇1,2, 王志琴1,2, 杨建昌1,2,*()
ZHOU Qun1,2(), YUAN Rui1,2, ZHU Kuan-Yu1,2, WANG Zhi-Qin1,2, YANG Jian-Chang1,2,*()
摘要:
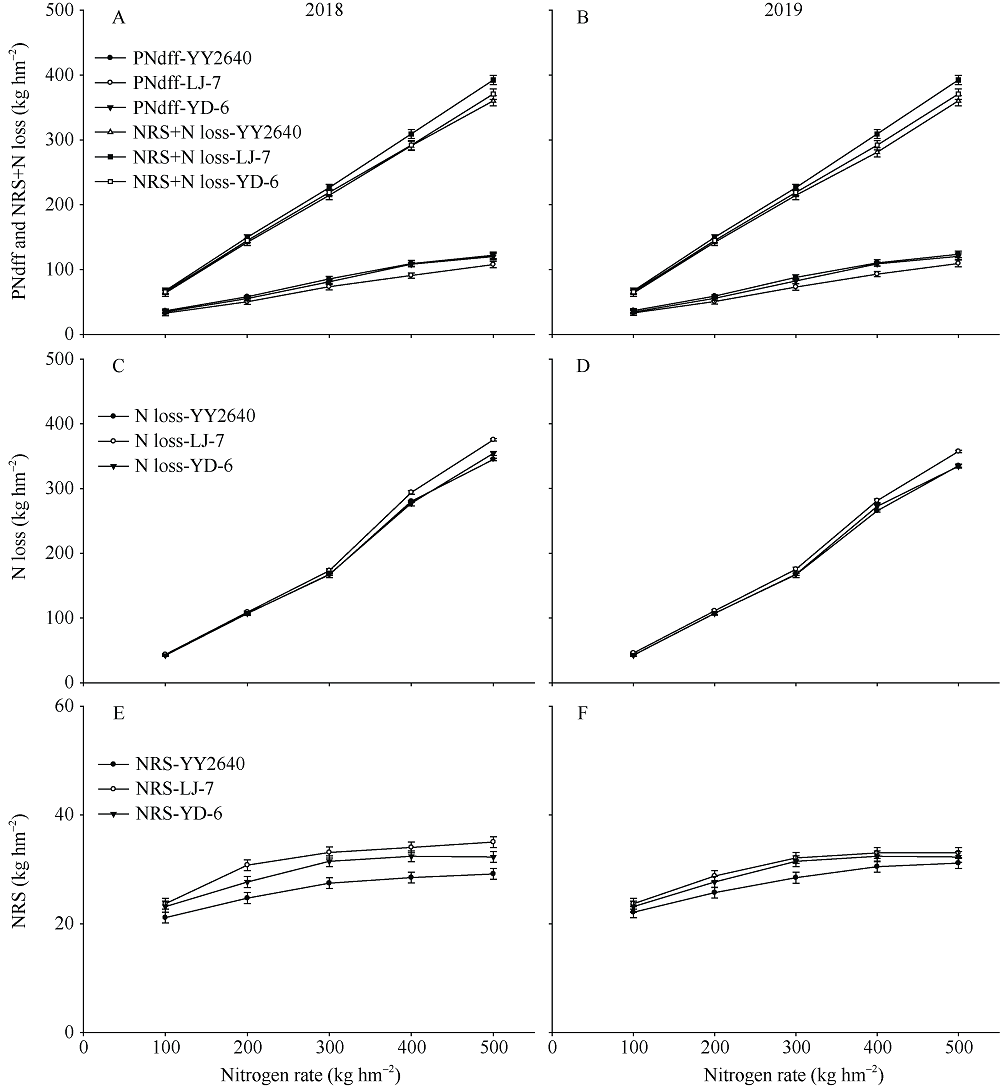
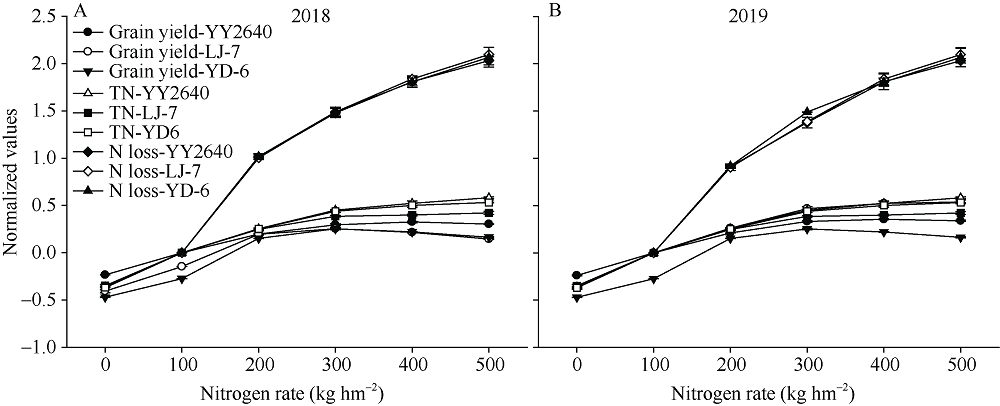
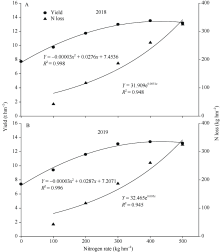
旨在探明在不同施氮量下籼/粳杂交稻产量、氮素吸收利用及损失的特点。2018—2019年籼/粳杂交稻品种甬优2640和常规粳稻品种连粳7号(对照品种1)和常规籼稻品种扬稻6号(对照品种2)种植于大田, 设置6种施氮量(0、100、200、300、400和500 kg hm-2)处理和15N示踪微区试验。3个供试品种的产量均随施氮量的增加呈现先增加后降低的趋势, 甬优2640在施氮量为400 kg hm-2时产量最高, 连粳7号和扬稻6号均在施氮量为300 kg hm-2时产量最高。在相同施氮量下, 甬优2640的产量高于对照品种。15N示踪试验表明, 适量增加施氮量(甬优2640≤400 kg hm-2、连粳7号和扬稻6号≤300 kg hm-2), 可以增加成熟期植株和穗中肥料氮积累量、土壤中的残留量、肥料氮对植株地上部氮积累量的贡献率、肥料氮的损失量和损失率, 降低土壤氮对植株地上部氮积累量的贡献率、肥料氮的植株吸收利用率和在土壤的残留率。在相同施氮量下, 甬优2640的肥料氮吸收量、在穗中的积累量、对植株地上部氮积累量的贡献率均高于对照品种, 肥料氮的损失量、损失率、在土壤的残留率均低于对照品种。肥料氮的21.0%~35.7%、6.7%~23.7%和42.3%~72.6%分别被植株吸收、残留在土壤中以及流失到了生态系统中。在相同施氮量条件下, 与常规高产品种相比, 籼/粳杂交稻甬优2640的产量和氮吸收利用率均较高, 氮损失率较低。在本试验条件下, 甬优2640产量和氮肥利用效率协同提高的施氮量为300 kg hm-2, 产量可达13.0 t hm-2。
| [1] | FAOSTAT. FAO Statistical Databases, Food and Agriculture Organization (FAO) of the United Nations, Rome, 2019 [2021-10-07]. http://www.fao.org/. |
| [2] | International Rice Research Institute. Rice Almanac, Fourth edition. Manila, Philippines: International Rice Research Institute, 2013. pp 1-64. https://www.irri.org/. |
| [3] |
Peng S B, Tang Q Y, Zou Y B. Current status and challenges of rice production in China. Plant Prod Sci, 2009, 12: 3-8.
doi: 10.1626/pps.12.3 |
| [4] | 国家统计局. 国家统计局关于2020年粮食产量数据的公告. 2020 [2021-10-07]. http://www.stats.gov.cn |
| National Bureau of Statistics, Announcement of the National Bureau of Statistics on grain production data in 2020 [2021-10-07]. http://www.stats.gov.cn. (in Chinese) | |
| [5] | 张福锁, 王激清, 张卫峰, 崔振岭, 马文奇, 陈新平, 江荣风. 中国主要粮食作物肥料利用率现状与提高途径. 土壤学报, 2008, 45: 915-924. |
| Zhang F S, Wang J Q, Zhang W F, Cui Z L, Ma W Q, Chen X P, Jiang R F. Nutrient use efficiencies of major cereal crops in China and measures for improvement. Acta Pedol Sin, 2008, 45: 915-924. (in Chinese with English abstract) | |
| [6] |
Zhang F S, Chen X P, Vitousek P. An experiment for the world. Nature, 2013, 497: 33-35.
doi: 10.1038/497033a |
| [7] |
Liu L J, Chen T T, Wang Z Q, Zhang H, Yang J C, Zhang J H. Combination of site-specific nitrogen management and alternate wetting and drying irrigation increases grain yield and nitrogen and water use efficiency in super rice. Field Crops Res, 2013, 154: 226-235.
doi: 10.1016/j.fcr.2013.08.016 |
| [8] |
Peng S B, Buresh R J, Huang J L, Zhong X H, Zou J C, Wang G H, Liu Y Y, Hu R F, Tang K H, Zhang F S, Dobermann A. Improving nitrogen fertilization in rice by site-specific N management. Agron Sustain Dev, 2010, 30: 649-656.
doi: 10.1051/agro/2010002 |
| [9] |
Ju X T, Xing G X, Chen X P, Zhang S L, Zhang L J, Liu X J, Cui Z L, Yin B, Christie P, Zhu Z L, Zhang F S. Reducing environmental risk by improving N management in intensive Chinese agricultural systems. Proc Natl Acad Sci USA, 2009, 106: 3041-3046.
doi: 10.1073/pnas.0813417106 |
| [10] |
Peng S B, Buresh R J, Huang J L, Yang J C, Zou Y B, Zhong X H, Wang G H, Zhang F S. Strategies for overcoming low agronomic nitrogen use efficiency in irrigated rice systems in China. Field Crops Res, 2006, 96: 37-47.
doi: 10.1016/j.fcr.2005.05.004 |
| [11] |
Xue Y G, Duan H, Liu L J, Wang Z Q, Yang J C, Zhang J H. An improved crop management increases grain yield and nitrogen and water use efficiency in rice. Crop Sci, 2013. 53: 271-284.
doi: 10.2135/cropsci2012.06.0360 |
| [12] |
Cui Z L, Zhang H Y, Chen X P, Zhang C C, Ma W Q, Huang C D, Zhang W F, Mi G H, Miao Y X, Li X L, Gao Q, Yang J C, Wang Z H, Ye Y L, Guo S W, Lu J W, Huang J L, Lu S H, Sun Y X, Liu Y Y, Peng X L, Ren J, Li S Q, Deng X P, Shi X J, Zhang Q, Yang Z P, Tang L, Wei C Z, Jia L L, Zhang J W, He M R, Tong Y A, Tang Q Y, Zhong X H, Liu Z H, Cao N, Kou C L, Ying H, Yin Y L, Jiao X Q, Zhang Q S, Fan M S, Jiang R F, Zhang F S, Dou Z X. Pursuing sustainable productivity with millions of smallholder farmers. Nature, 2018, 555: 363-367.
doi: 10.1038/nature25785 |
| [13] |
Guo J H, Liu X J, Zhang Y, Shen J L, Han W X, Zhang W F, Christie P, Goulding K W T, Vitousek P M, Zhang F S. Significant acidification in major Chinese croplands. Science, 2010, 327: 1008-1010.
doi: 10.1126/science.1182570 pmid: 20150447 |
| [14] | 王飞, 彭少兵. 水稻绿色高产栽培技术研究进展. 生命科学, 2018, 30: 1129-1136. |
| Wang F, Peng S B. Research progress in rice green and high-yield management practices. Chin Life Sci Bull, 2018, 30: 1129-1136. (in Chinese with English abstract) | |
| [15] |
Ma G H, Yuan L P. Hybrid rice achievements, development and prospect in China. J Integr Agric, 2015, 14: 197-205.
doi: 10.1016/S2095-3119(14)60922-9 |
| [16] | 袁隆平. 两系法杂交水稻研究的进展. 中国农业科学, 1990, 23: 1-6. |
| Yuan L P. Progress of two-line hybrid rice breeding. Sci Agric Sin, 1990, 23: 1-6. (in Chinese with English abstract) | |
| [17] | 林建荣, 宋昕蔚, 吴明国, 程式华. 籼粳超级杂交稻育种技术创新与品种培育. 中国农业科学, 2016, 49: 207-218. |
| Lin J R, Song X W, Wu M G, Cheng S H. Breeding technology innovation of indica-japonica super hybrid rice and varietal breeding. Sci Agric Sin, 2016, 49: 207-218. (in Chinese with English abstract) | |
| [18] | 桂君梅, 王林友, 范小娟, 祁永斌, 张礼霞, 范宏环, 金庆生, 王建军. 基于InDel分子标记的籼粳杂交稻与粳粳杂交稻的杂种优势比较研究. 中国农业科学, 2016, 49: 219-231. |
| Gui J M, Wang L Y, Fan X J, Qi Y B, Zhang L X, Fan H H, Jin Q S, Wang J J. Comparison the heterosis of indica-japonica hybrids and japonica-japonica hybrids using InDel markers. Sci Agric Sin, 2016, 49: 219-231. (in Chinese with English abstract) | |
| [19] |
Wang D Y, Xu C M, Yan J X, Zhang X G, Chen S, Chauhan B S, Wang L, Zhang X F. 15N tracer-based analysis of genotypic differences in the uptake and partitioning of N applied at different growth stages in transplanted rice. Field Crops Res, 2017, 211: 27-36.
doi: 10.1016/j.fcr.2017.06.017 |
| [20] | 李鹏飞, 李小坤, 侯文峰, 任涛, 丛日环, 杜昌文, 邢烈火, 王少华, 鲁剑巍. 应用15N示踪技术研究控释尿素在稻田中的去向及利用率. 中国农业科学, 2018, 51: 3961-3971. |
| Li P F, Li X K, Hou W F, Ren T, Cong R H, Du C W, Xing L H, Wang S H, Lu J W. Studying the fate and recovery efficiency of controlled release urea in paddy soil using 15N tracer technique. Sci Agric Sin, 2018, 51: 3961-3971. (in Chinese with English abstract) | |
| [21] | 曹亚澄, 张金波, 温腾. 稳定同位素示踪技术与质谱分析——在土壤、生态、环境研究中的应用. 北京: 科学出版社, 2018. pp 128-144. |
| Cao Y C, Zhang J B, Wen T. Stable Isotope Tracer Technique and Mass Spectrometry:Application in Soil, Ecology and Environment Research. Beijing: Science Press, 2018. pp 128-144. (in Chinese) | |
| [22] |
Xiong D L, Ling X X, Huang J L, Peng S B. Meta-analysis and dose-response analysis of high temperature effects on rice yield and quality. Environ Exp Bot, 2017, 141: 1-9.
doi: 10.1016/j.envexpbot.2017.06.007 |
| [23] | 刘竞妍, 张可, 王桂华. 综合评价中数据标准化方法比较研究. 数字技术与应用, 2018, 36(6): 84-85. |
| Liu J K, Zhang K, Wang G H. Comparative study on data standardization methods in comprehensive evaluation. Digit Technol Appl, 2018, 36(6): 84-85. (in Chinese with English abstract) | |
| [24] | 王静. 氮肥运筹对长江中游中稻产量、氮肥利用率和氮素损失影响的研究. 华中农业大学博士学位论文, 湖北武汉, 2019. |
| Wang J. The Effects of Nitrogen Management on Grain Yield, Nitrogen Use Efficiency and Nitrogen Loss of Middle Rice in the Middle of Yangtze River Basin of China. PhD Dissertation of Huazhong Agricultural University, Wuhan, Hubei, China, 2019. (in Chinese with English abstract) | |
| [25] |
Yoshida H, Horic T, Shiraiwa T. A model explaining genotypic and environment variation of rice spikelet number per unit area measured by cross-location experiments in Asia. Field Crops Res, 2006, 97: 337-343.
doi: 10.1016/j.fcr.2005.11.004 |
| [26] |
Zhang H, Yu C, Kong X S, Hou D P, Gu J F, Liu L J, Wang Z Q, Yang J C. Progressive integrative crop managements increase grain yield, nitrogen use efficiency and irrigation water productivity in rice. Field Crops Res, 2018, 215: 1-11.
doi: 10.1016/j.fcr.2017.09.034 |
| [27] | 杨建昌, 王朋, 刘立军, 王志琴, 朱庆森. 中籼水稻品种产量与株型演进特征研究. 作物学报, 2006, 32: 949-955. |
| Yang J C, Wang P, Liu L J, Wang Z Q, Zhu Q S. Evolution characteristics of grain yield and plant type for mid-season indica cultivars. Acta Agron Sin, 2006, 32: 949-955. (in Chinese with English abstract) | |
| [28] | 杨惠杰, 李义珍, 杨仁崔, 姜照伟, 郑景生. 超高产水稻的干物质生产特性研究. 中国水稻科学, 2001, 15(4): 26-31. |
| Yang H Z, Li Y Z, Yang R C, Jiang Z W, Zheng J S. Dry matter production characteristics of super high yielding rice. Chin J Rice Sci, 2001, 15(4): 26-31. (in Chinese with English abstract) | |
| [29] |
张耗, 谈桂露, 薛亚光, 王志琴, 刘立军, 杨建昌. 江苏省粳稻品种近60年演进过程中产量与形态生理特征的变化. 作物学报, 2010, 36: 133-140.
doi: 10.3724/SP.J.1006.2010.00133 |
| Zhang H, Tan G L, Xue Y G, Wang Z Q, Liu L J, Yang J C. Changes in grain yield and morphological and physiological characteristics during 60-year evolution of japonica rice cultivars in Jiangsu province, China. Acta Agron Sin, 2010, 36: 133-140. (in Chinese with English abstract) | |
| [30] |
张耗, 黄钻华, 王静超, 王志琴, 杨建昌. 江苏中籼水稻品种演进过程中根系形态生理性状的变化及其与产量的关系. 作物学报, 2011, 37: 1020-1030.
doi: 10.3724/SP.J.1006.2011.01020 |
|
Zhang H, Huang Z H, Wang J C, Wang Z Q, Yang J C. Changes in morphological and physiological traits of roots and their relationships with grain yield during the evolution of mid-season Indica rice cultivars in Jiangsu province. Acta Agron Sin, 2011, 37: 1020-1030. (in Chinese with English abstract)
doi: 10.3724/SP.J.1006.2011.01020 |
|
| [31] |
Mohapatra P K, Sahu S K. Heterogeneity of primary branch development and spikelet survival in rice panicle in relation to assimilates of primary branches. J Exp Bot, 1991, 42: 871-879.
doi: 10.1093/jxb/42.7.871 |
| [32] | 杨建昌, 杜永, 吴长付, 刘立军, 王志琴, 朱庆森. 超高产粳型水稻生长发育特性的研究. 中国农业科学, 2006, 39: 1336-1345. |
| Yang J C, Du Y, Wu C F, Liu L J, Wang Z Q, Zhu Q S. Growth and development characteristics of super-high-yielding mid- season japonica rice. Sci Agric Sin, 2006, 39: 1336-1345. (in Chinese with English abstract) | |
| [33] | 李晓芸, 孟天瑶, 戴其根. 中熟类型甬优籼粳杂交稻组合产量优势形成及其形态生理特征. 中国稻米, 2017, 23(1): 10-16. |
| Li X Y, Meng T Y, Dai Q G. Yield formation and morphological and physiological characteristics of medium-maturity type of Yongyou Japohica/Indica hybrid rice. China Rice, 2017, 23(1): 10-16. (in Chinese with English abstract) | |
| [34] | 晏娟, 尹斌, 张绍林, 沈其荣, 朱兆良. 不同施氮量对水稻氮素吸收与分配的影响. 植物营养与肥料学报, 2008, 14: 835-839. |
| Yan J, Yin B, Zhang S L, Shen Q R, Zhu Z L. Effect of nitrogen application rate on nitrogen uptake and distribution in rice. Plant Nutr Fert Sci, 2008, 14: 835-839 (in Chinese with English abstract). | |
| [35] | Huang M, Jiang L, Xia B. Yield gap analysis of super hybrid rice between two subtropical environments. Aust J Crop Sci, 2013, 7: 600-608. |
| [36] |
Xiong Y M, X L. Low nitrogen retention in soil and litter under conditions without plants in a subtropical pine plantation. Forests, 2015, 6: 2387-2404.
doi: 10.3390/f6072387 |
| [37] |
Liu X J A, Van Groenigen K J, Dijkstra P. Increased plant uptake of native soil nitrogen following fertilizer addition-not a priming effect. Appl Soil Ecol, 2017, 114: 105-110.
doi: 10.1016/j.apsoil.2017.03.011 |
| [38] |
Kuzyakov Y, Friedel J K, K Stahr. Review of mechanisms and quantification of priming effects. Soil Biol Biochem, 2000, 32: 1485-1498.
doi: 10.1016/S0038-0717(00)00084-5 |
| [39] |
Huang J, He F, Cui K. Determination of optimal nitrogen rate for rice varieties using a chlorophyll meter. Field Crops Res, 2008, 105: 70-80.
doi: 10.1016/j.fcr.2007.07.006 |
| [40] |
Zhao X, Xie Y X, Xiong Z Q. Nitrogen fate and environmental consequence in paddy soil under rice-wheat rotation in the Taihu lake region, China. Plant Soil, 2009, 319: 225-234.
doi: 10.1007/s11104-008-9865-0 |
| [41] |
Reddy. Uptake efficiency of 15N-urea in flooded and aerobic rice fields under semi-arid conditions. Paddy Water Environ, 2015, 13: 545-556.
doi: 10.1007/s10333-014-0473-8 |
| [42] | 杨利, 张建峰, 张富林, 范先鹏, 杨俊诚, 杨永成, 熊桂云, 吴运明, 余延丰, 符家安. 长江中下游地区氮肥减施对稻麦轮作体系作物氮吸收、利用与氮素平衡的影响. 西南农业学报, 2013, 26(1): 195-202. |
| Yang L, Zhang J F, Zhang F L, Fan X P, Yang J C, Yang Y C, Xiong G Y, Wu Y M, Yu Y F, Fu J A. Effects of reducing N application on crop N uptake, utilization and soil N balance under rice-wheat rotation system on middle and lower reaches of Yangtze River region. Southwest China J Agric Sci, 2013, 26(1): 195-202. (in Chinese with English abstract) | |
| [43] | Zhang Q W, Yang Z L, Zhang H, Yi J. Recovery efficiency and loss of 15N-labelled urea in a rice-soil system in the upper reaches of the Yellow River basin. Agric Ecosyst Environt, 2012, 158: 118-126. |
| [44] | Cao Y S, Yin B. Effects of integrated high-efficiency practice versus conventional practice on rice yield and N fate. Agric Ecosyst Environt, 2015, 202: 1-7. |
| [45] |
Pan S G, Huang S Q, Zhai J, Wang J P, Cao C G, Cai M L, Zhan M, Tang X R. Effects of N management on yield and N uptake of rice in central China. J Integr Agric, 2012, 11: 1993-2000.
doi: 10.1016/S2095-3119(12)60456-0 |
| [46] |
魏颖娟, 夏冰, 赵杨, 邹应斌. 15N示踪不同施氮量对超级稻产量形成及氮素吸收的影响. 核农学报, 2016, 30: 783-791.
doi: 10.11869/j.issn.100-8551.2016.04.0783 |
| Wei Y J, Xia B, Zhao Y, Zou Y B. Effects of nitrogen application on yield formation and the nitrogen absorption and utilization of super rice based on 15N-tracing. Acta Agric Nucl Sin, 2016, 30: 783-791. (in Chinese with English abstract) | |
| [47] | Zhu Z L. Fate and management of fertilizer nitrogen in agro-ecosystems. In: Zhu Z, Wen Q, Freney J R, eds. Nitrogen in Soils of China. Springer, Dordrecht: Developments in Plant and Soil Sciences, 1997. pp 239-279. https://link.springer.com/book/10.1007/978-94-011-5636-3. |
| [48] |
Zhang H, Xue Y G, Wang Z Q, Yang J C, Zhang J H. Morphological and physiological traits of roots and their relationships with shoot growth in “super” rice. Field Crops Res, 2009, 113: 31-40.
doi: 10.1016/j.fcr.2009.04.004 |
| [49] | Chu G, Chen S, Xu C M, Wang D Y, Zhang X F. Agronomic and physiological performance of indica/japonica hybrid rice cultivar under low nitrogen conditions. Field Crops Res, 2019, 243: 107625. |
| [50] |
Zhu K, Zhou Q, Shen Y, Shen Y, Yan J Q, Xu Y J, Wang Z Q, Yang J C. Agronomic and physiological performance of an indica-japonica rice variety with a high yield and high nitrogen use efficiency. Crop Sci, 2020, 60: 1556-1568.
doi: 10.1002/csc2.20150 |
| [51] |
Zhou Q, Ju C X, Wang Z Q, Zhang H, Liu L J, Yang J C, Zhang J H. Grain yield and water use efficiency of super rice under soil water deficit and alternate wetting and drying irrigation. J Integr Agric, 2017, 16: 1028-1043.
doi: 10.1016/S2095-3119(16)61506-X |
| [52] |
Cassman K G, Peng S, Olk D C, Ladha J K, Reichardt W, Dobermann A, Singh U. Opportunities for increased nitrogen-use efficiency from improved resource management in irrigated rice system. Field Crops Res, 1998, 56: 7-39.
doi: 10.1016/S0378-4290(97)00140-8 |
| [53] |
Zhou Z C, Gan Z T, Shangguan Z P, Zhang F P. Effects of long-term repeated mineral and organic fertilizer applications on soil organic carbon and total nitrogen in a semi-arid cropland. Eur J Agron, 2013, 45: 20-26.
doi: 10.1016/j.eja.2012.11.002 |
| [54] |
Pandey A, Mai V T, Vu D Q, Bui T P, Mai T L, Jensen L S, Neergaard A. Organic matter and water management strategies to reduce methane and nitrous oxide emissions from rice paddies in Vietnam. Agric Ecosyst Environ, 2014, 196: 137-146.
doi: 10.1016/j.agee.2014.06.010 |
| [1] | 陈志青, 冯源, 王锐, 崔培媛, 卢豪, 魏海燕, 张海鹏, 张洪程. 外源钼对水稻产量形成及氮素利用的影响[J]. 作物学报, 2022, 48(9): 2325-2338. |
| [2] | 张振博, 屈馨月, 于宁宁, 任佰朝, 刘鹏, 赵斌, 张吉旺. 施氮量对夏玉米籽粒灌浆特性和内源激素作用的影响[J]. 作物学报, 2022, 48(9): 2366-2376. |
| [3] | 王云奇, 高福莉, 李傲, 郭同济, 戚留冉, 曾寰宇, 赵建云, 王笑鸽, 高国英, 杨佳鹏, 白金泽, 马亚欢, 梁月馨, 张睿. 小麦花后穗部温度变化规律及其与产量的关系[J]. 作物学报, 2022, 48(9): 2400-2408. |
| [4] | 刘昆, 黄健, 周沈琪, 张伟杨, 张耗, 顾骏飞, 刘立军, 杨建昌. 穗肥施氮量对不同穗型超级稻品种产量的影响及其机制[J]. 作物学报, 2022, 48(8): 2028-2040. |
| [5] | 李鑫, 王剑, 李亚兵, 韩迎春, 王占彪, 冯璐, 王国平, 熊世武, 李存东, 李小飞. 不同间套作模式对棉花产量和生物量累积、分配的影响[J]. 作物学报, 2022, 48(8): 2041-2052. |
| [6] | 杨飞, 张征锋, 南波, 肖本泽. 水稻产量相关性状的全基因组关联分析及候选基因筛选[J]. 作物学报, 2022, 48(7): 1813-1821. |
| [7] | 张少华, 段剑钊, 贺利, 井宇航, 郭天财, 王永华, 冯伟. 基于无人机平台多模态数据融合的小麦产量估算研究[J]. 作物学报, 2022, 48(7): 1746-1760. |
| [8] | 王丹, 周宝元, 马玮, 葛均筑, 丁在松, 李从锋, 赵明. 长江中游双季玉米种植模式周年气候资源分配与利用特征[J]. 作物学报, 2022, 48(6): 1437-1450. |
| [9] | 王旺年, 葛均筑, 杨海昌, 阴法庭, 黄太利, 蒯婕, 王晶, 汪波, 周广生, 傅廷栋. 大田作物在不同盐碱地的饲料价值评价[J]. 作物学报, 2022, 48(6): 1451-1462. |
| [10] | 颜佳倩, 顾逸彪, 薛张逸, 周天阳, 葛芊芊, 张耗, 刘立军, 王志琴, 顾骏飞, 杨建昌, 周振玲, 徐大勇. 耐盐性不同水稻品种对盐胁迫的响应差异及其机制[J]. 作物学报, 2022, 48(6): 1463-1475. |
| [11] | 杨欢, 周颖, 陈平, 杜青, 郑本川, 蒲甜, 温晶, 杨文钰, 雍太文. 玉米-豆科作物带状间套作对养分吸收利用及产量优势的影响[J]. 作物学报, 2022, 48(6): 1476-1487. |
| [12] | 陈静, 任佰朝, 赵斌, 刘鹏, 张吉旺. 叶面喷施甜菜碱对不同播期夏玉米产量形成及抗氧化能力的调控[J]. 作物学报, 2022, 48(6): 1502-1515. |
| [13] | 李祎君, 吕厚荃. 气候变化背景下农业气象灾害对东北地区春玉米产量影响[J]. 作物学报, 2022, 48(6): 1537-1545. |
| [14] | 石艳艳, 马志花, 吴春花, 周永瑾, 李荣. 垄作沟覆地膜对旱地马铃薯光合特性及产量形成的影响[J]. 作物学报, 2022, 48(5): 1288-1297. |
| [15] | 闫晓宇, 郭文君, 秦都林, 王双磊, 聂军军, 赵娜, 祁杰, 宋宪亮, 毛丽丽, 孙学振. 滨海盐碱地棉花秸秆还田和深松对棉花干物质积累、养分吸收及产量的影响[J]. 作物学报, 2022, 48(5): 1235-1247. |
|
||