欢迎访问作物学报,今天是
作物学报 ›› 2024, Vol. 50 ›› Issue (4): 991-1003.doi: 10.3724/SP.J.1006.2024.31041
黄宏胜( ), 张馨月, 居辉, 韩雪()
HUANG Hong-Sheng(), ZHANG Xin-Yue, JU Hui, HAN Xue()
摘要:
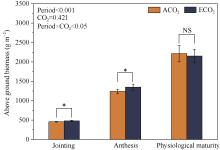
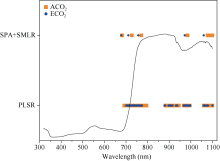
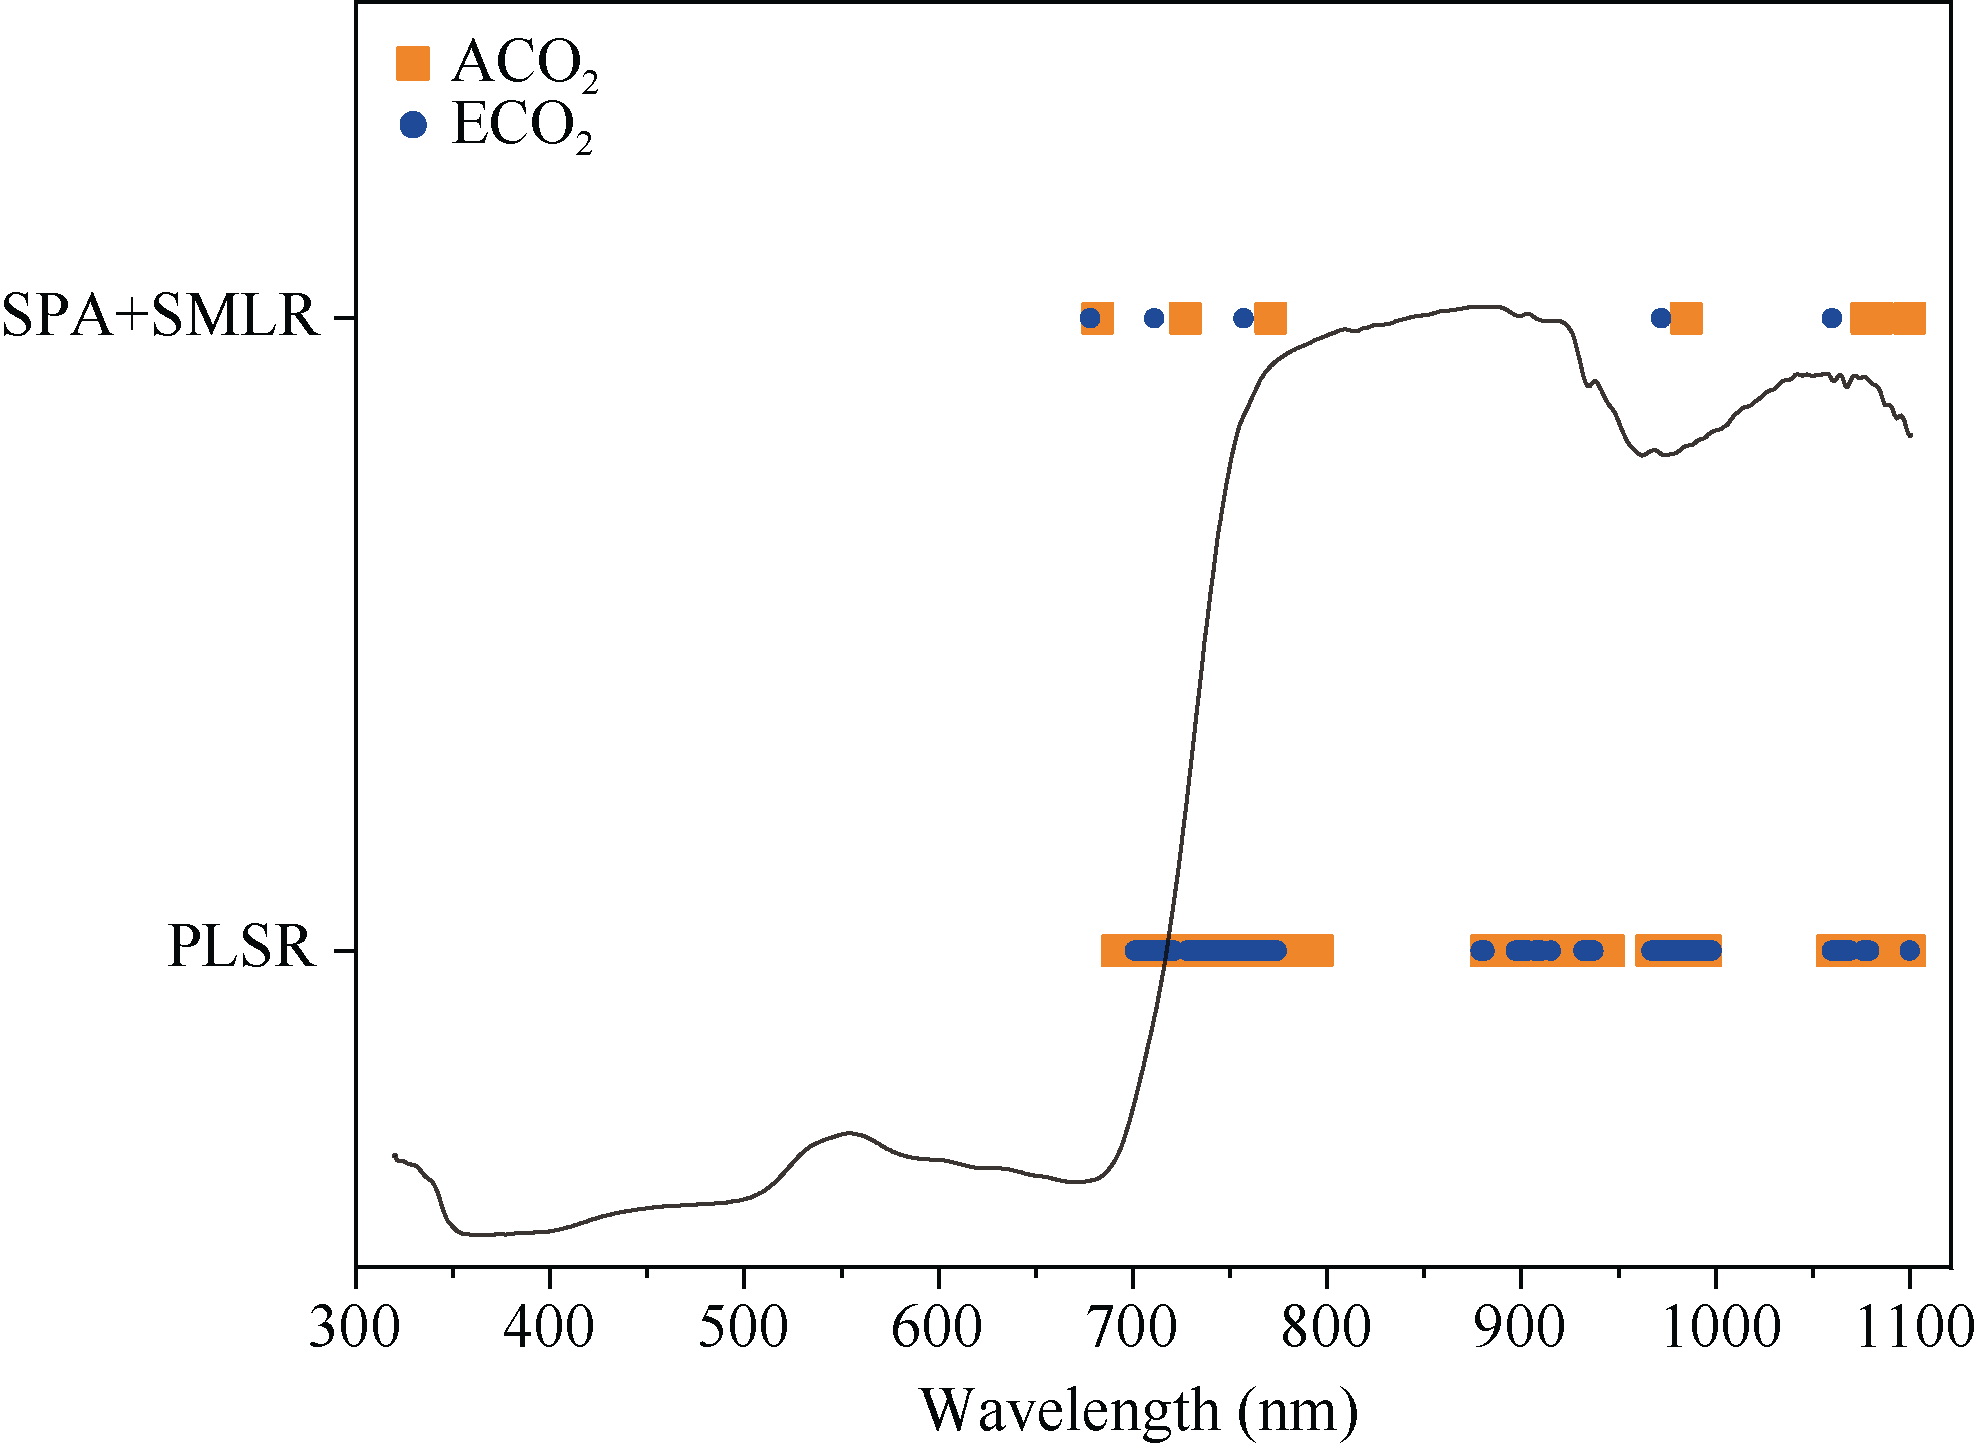
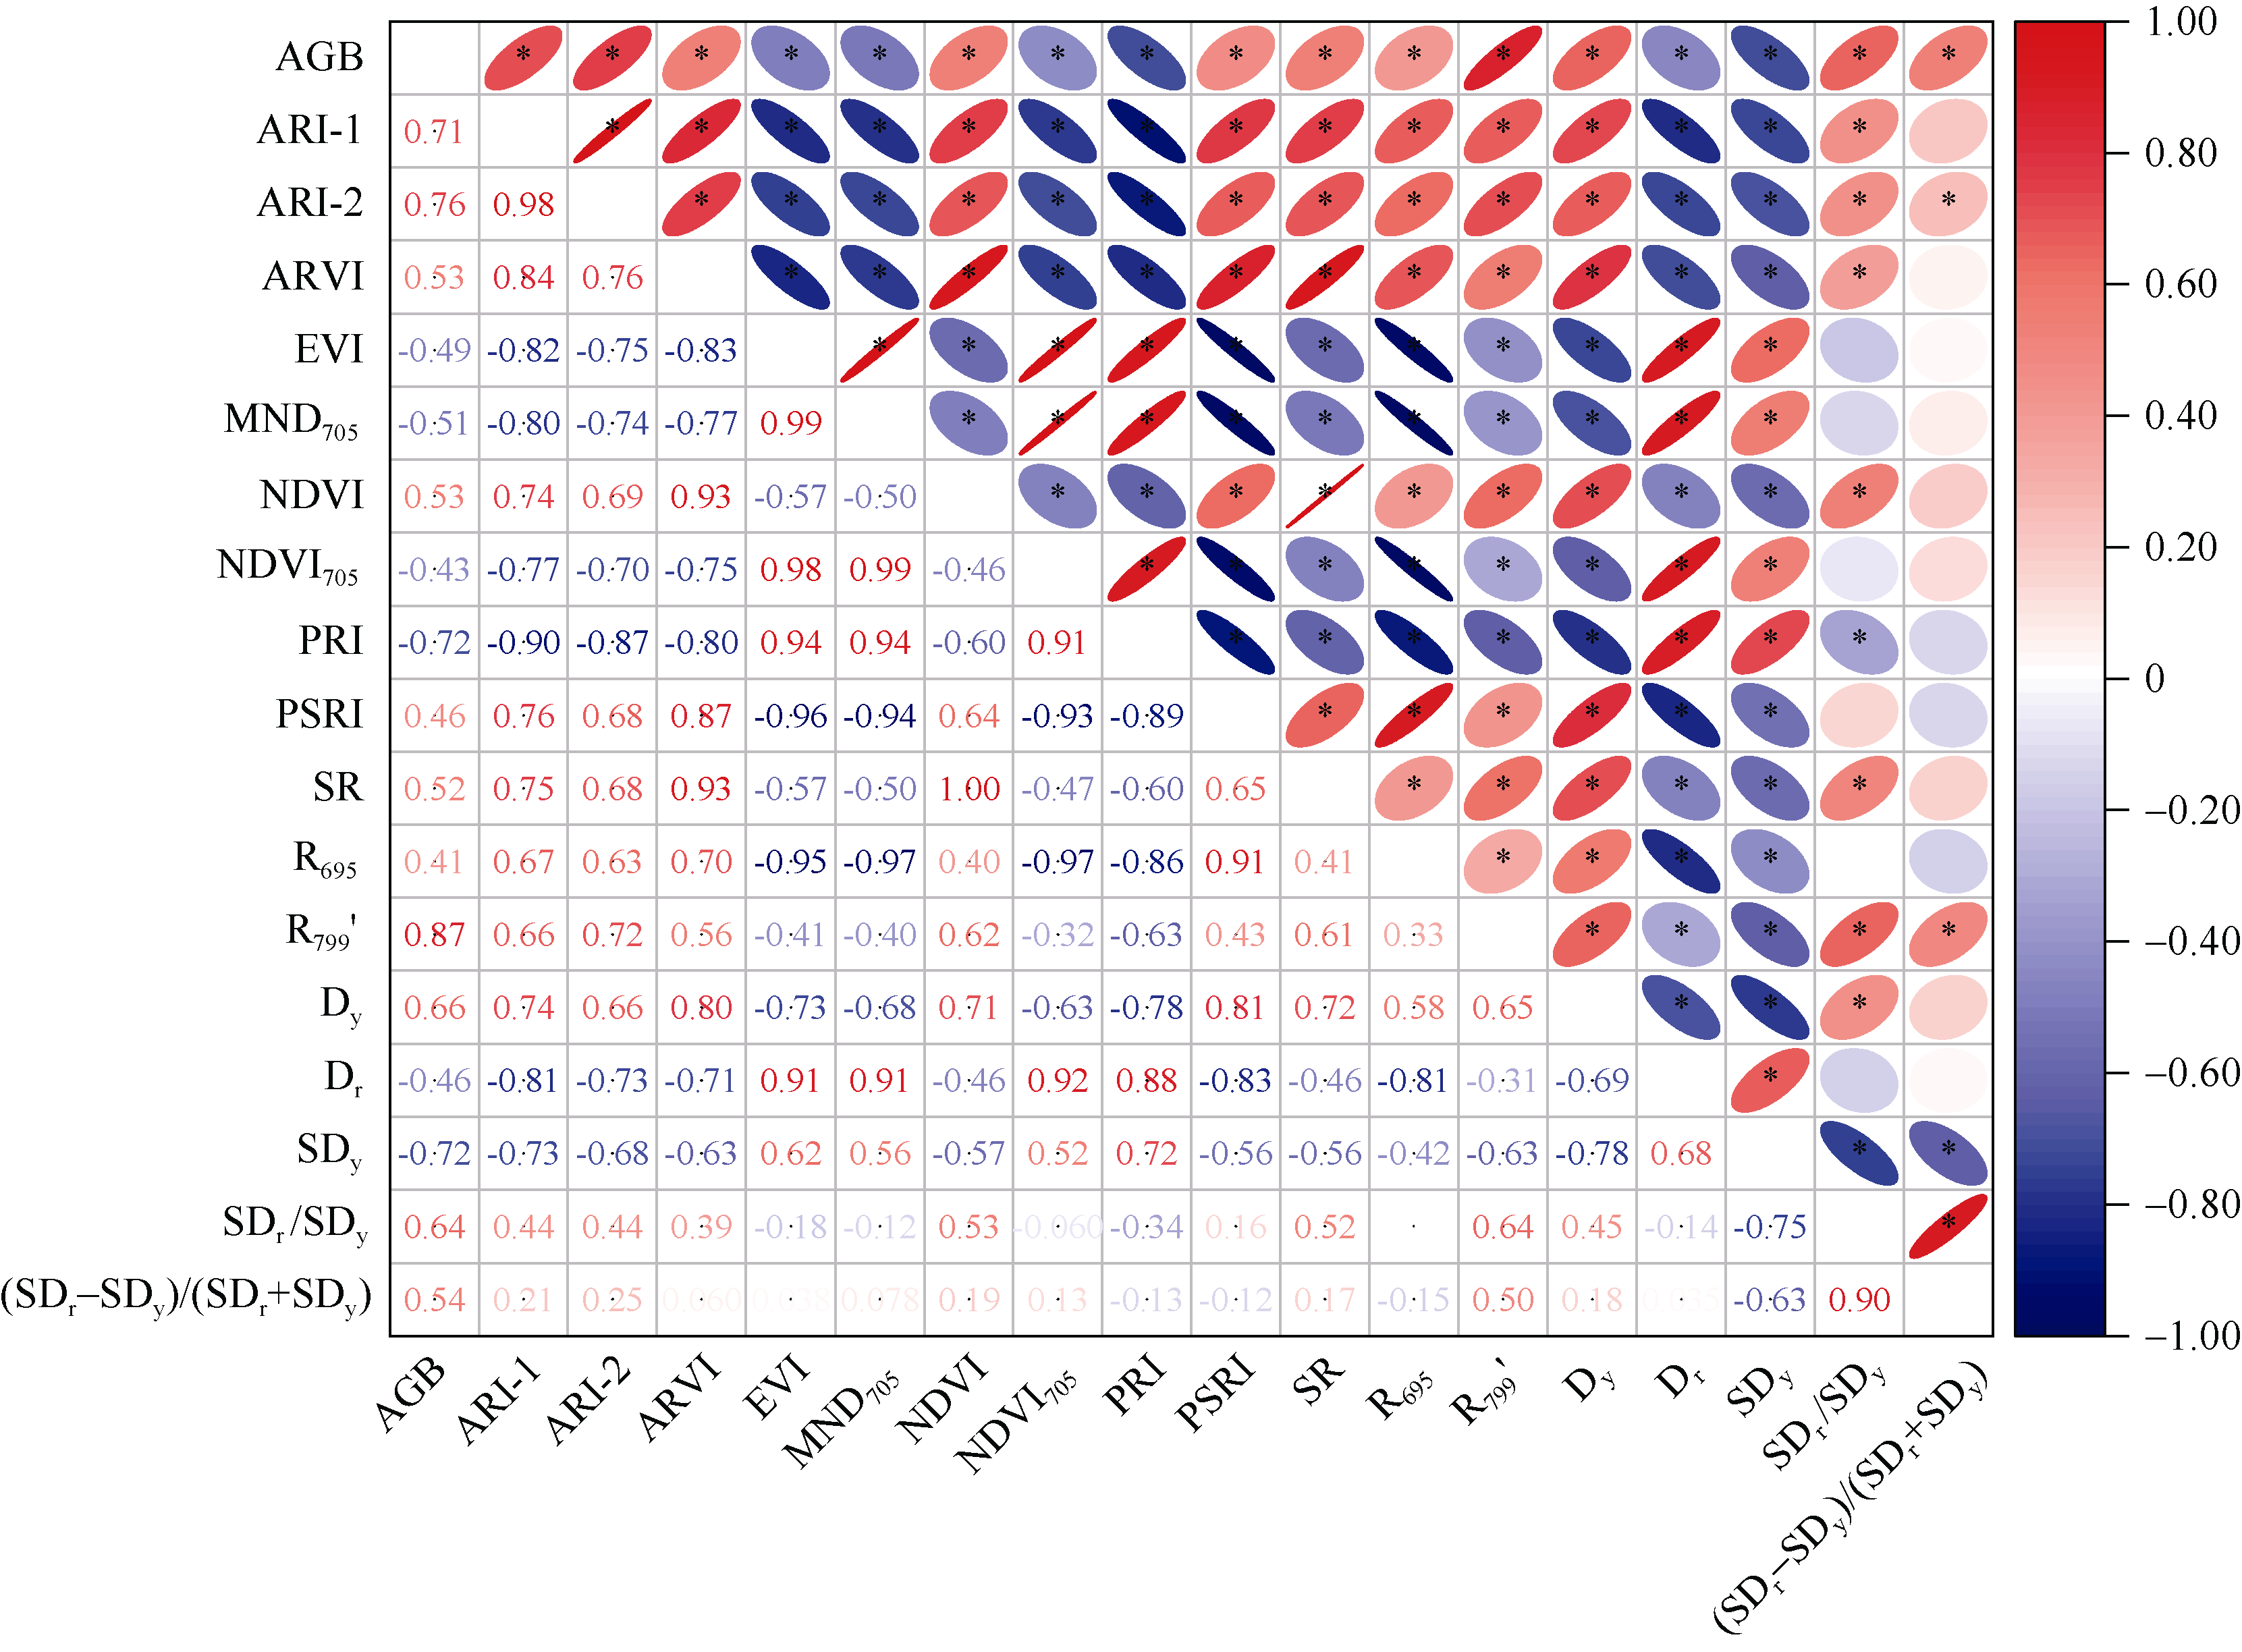
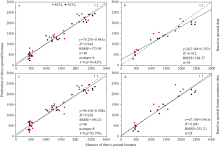
本研究旨在探究大气CO2浓度升高对冬小麦全生育时期冠层光谱特征的影响, 并基于筛选的敏感波段建立地上生物量(AGB)与光谱参数的定量关系。为此, 在2021—2022年的冬小麦生长季, 利用开放式CO2富集系统(Mini-FACE), 设定大气CO2浓度(ACO2, (420±20) μL L-1)和高CO2浓度(ECO2, (550±20) μL L-1)两个处理水平, 分析了高CO2浓度下光谱特征变化, 基于连续投影算法(SPA)、逐步多元线性回归(SMLR)和偏最小二乘法回归(PLSR)筛选AGB敏感波段并构建估算模型。结果表明: CO2浓度升高使冬小麦拔节期和开花期AGB显著增加。红边和近红边反射率及红边面积在拔节期增加, 在开花期和灌浆期降低, 蓝边、黄边和红边位置在不同生育时期均发生移动; AGB的敏感光谱波段主要分布在红边和近红边区域, CO2浓度升高缩小了AGB敏感波段范围, 但不影响AGB的估算; AGB的SMLR和PLSR模型均取得了较高的估算精度(R2>0.8), 其中SMLR模型中的R799′、Dy、SDy和PRI等特征参数与AGB显著相关, R2为0.866。PLSR模型(R2>0.9)在估算精度和稳定性上优于SMLR模型。本研究可为未来高CO2浓度下冬小麦生长发育的遥感监测提供理论基础和技术方法。
| [1] | 王卓妮, 袁佳双, 庞博, 黄磊. IPCC AR6《气候变化2022: 减缓气候变化》主要结论和启示. 气候变化研究进展, 2022, 18: 531-537. |
| Wang Z N, Yuan J S, Pang B, Huang L. The interpretation and highlights of IPCC AR6 WGIII report climate change 2022:mitigation of climate change. Climate Chang Res, 2022, 18: 531-537. (in Chinese with English abstract) | |
| [2] |
Ainsworth E A, Long S P. What have we learned from 15 years of free air CO2 enrichment (FACE)? A meta-analytic review of the responses of photosynthesis, canopy properties and plant production to rising CO2. New Phytol, 2005, 165: 351-371.
doi: 10.1111/nph.2005.165.issue-2 |
| [3] |
Sinha P G, Kapoor R, Uprety D C, Bhatnagar A K. Impact of elevated CO2 concentration on ultrastructure of pericarp and composition of grain in three Triticum species of different ploidy levels. Environ Exp Bot, 2009, 66: 451-456.
doi: 10.1016/j.envexpbot.2009.04.006 |
| [4] |
Li B, Xu X, Zhang L, Han J, Bian C, Li G, Liu J, Jin L. Above-ground biomass estimation and yield prediction in potato by using UAV-based RGB and hyperspectral imaging. ISPRS J Photogramm Remote Sens, 2020, 162: 161-172.
doi: 10.1016/j.isprsjprs.2020.02.013 |
| [5] |
Miller G J, Morris J T, Wang C. Estimating aboveground biomass and its spatial distribution in coastal wetlands utilizing planet multispectral imagery. Remote Sens, 2019, 11: 1-16.
doi: 10.3390/rs11010001 |
| [6] |
Tian H, Shi S, Wang H, Li F, Li Z, Alva A, Zhang Z. Estimation of sugar beet aboveground biomass by band depth optimization of hyperspectral canopy reflectance. J Indian Soc Remote Sens, 2016, 45: 795-803.
doi: 10.1007/s12524-016-0632-z |
| [7] |
Xie Y, Wang C, Yang W, Feng M, Qiao X, Song J. Canopy hyperspectral characteristics and yield estimation of winter wheat (Triticum aestivum) under low temperature injury. Sci Rep, 2020, 10: 244-254.
doi: 10.1038/s41598-019-57100-8 pmid: 31937859 |
| [8] | Dawson T P, Curran P J. A new technique for interpolating the reflectance red edge position. Int J Remote Sens, 1998, 1: 2133-2139. |
| [9] | 郑红平, 邹红玉. 浅述植被“红边”效应及其定量分析方法. 遥感信息, 2010, 25(4): 112-116. |
| Zheng H P, Zou H Y. The effect and method of quantitative analysis of “Red Edge” of vegetation. Remote Sens Inf, 2010, 25(4): 112-116. (in Chinese with English abstract) | |
| [10] |
蔡瑶, 缪宇轩, 吴浩, 王丹. 高CO2浓度下冬小麦的高光谱特征及其与叶面积指数和SPAD值的反演. 浙江农业学报, 2022, 34: 582-589.
doi: 10.3969/j.issn.1004-1524.2022.03.19 |
| Cai Y, Miao Y X, Wu H, Wang D. Hyperspectral characteristics and leaf area index (LAI) and SPAD value inversion of winter wheat under elevated CO2 concentration. Acta Agric Zhejiangensis, 2022, 34: 582-589. (in Chinese with English abstract) | |
| [11] | 杨璐璐, 华开, 张学霞. 不同CO2浓度及干旱胁迫下高羊茅的生理响应和光谱特征. 中国草地学报, 2014, 36(4): 72-78. |
| Yang L L, Hua K, Zhang X X. The impacts of mowing on photosynthesis and water physiological conditions of Ceratoides latens. Chin J Grassland, 2014, 36(4): 72-78. (in Chinese with English abstract) | |
| [12] |
Sun Q, Gu X, Sun L, Yang G, Zhou L, Guo W. Dynamic change in rice leaf area index and spectral response under flooding stress. Paddy Water Environ, 2020, 18: 223-233.
doi: 10.1007/s10333-019-00776-5 |
| [13] | Ren P, Feng M C, Yang W D, Wang C, Liu T T, Wang H Q. Response of winter wheat (Triticum aestivum L.) hyperspectral characteristics to low temperature stress. Spectr Spect Anal, 2014, 34: 2490-2494. |
| [14] | Xu D Q, Liu X L, Wang W, Chen M, Kan H C, Li C F, Zheng S F. Hyper spectral characteristics and estimation model of leaf chlorophyll content in cotton under waterlogging stress. J Appl Ecol, 2017, 28: 3289-3296. |
| [15] |
Tschannerl J, Ren J, Yuen P, Sun G, Zhao H, Yang Z, Wang Z, Marshall S. MIMR-DGSA: unsupervised hyperspectral band selection based on information theory and a modified discrete gravitational search algorithm. Inf Fusion, 2019, 51: 189-200.
doi: 10.1016/j.inffus.2019.02.005 |
| [16] |
Steve D B, Pieter K, Paul S. Walter D. A band selection technique for spectral classification. IEEE Geosci Remote Sens Lett, 2005, 2: 319-323.
doi: 10.1109/LGRS.2005.848511 |
| [17] | Gao H Z, Lu Q P, Ding H Q, Peng Z Q. Choice of characteristic near-infrared wavelengths for soil total nitrogen based on successive projection algorithm. Spectr Spect Anal, 2009, 29: 2951-2954. |
| [18] |
Liu J, Xie J, Meng T, Dong H. Organic matter estimation of surface soil using successive projection algorithm. Agron J, 2022, 114: 1944-1951.
doi: 10.1002/agj2.v114.4 |
| [19] |
Xie Y, Feng M, Wang C, Yang W, Sun H, Yang C, Jing B, Qiao X, Saleem K M, Song J. Hyperspectral monitor on chlorophyll density in winter wheat under water stress. Agron J, 2020, 112: 3667-3676.
doi: 10.1002/agj2.v112.5 |
| [20] |
El-Hendawy S, Al-Suhaibani N, Alotaibi M, Hassan W, Elsayed S, Tahir M U, Mohamed A I, Schmidhalter U. Estimating growth and photosynthetic properties of wheat grown in simulated saline field conditions using hyperspectral reflectance sensing and multivariate analysis. Sci Rep, 2019, 9: 16473.
doi: 10.1038/s41598-019-52802-5 pmid: 31712701 |
| [21] |
Gitelson A A, Merzlyak M N, Chivkunova O B. Optical properties and non-destructive estimation of anthocyanin content in plant leaves? Photochem Photobiol, 2001, 74: 38-45.
doi: 10.1562/0031-8655(2001)074<0038:opaneo>2.0.co;2 pmid: 11460535 |
| [22] |
Merzlyak M N, Solovchenko A E, Gitelson A A. Reflectance spectral features and non-destructive estimation of chlorophyll, carotenoid and anthocyanin content in apple fruit. Postharvest Biol Technol, 2003, 27: 197-211.
doi: 10.1016/S0925-5214(02)00066-2 |
| [23] |
Kaufman Y J, Tanre D. Atmospherically resistant vegetation index (ARVI) for EOS-MODIS. IEEE Trans Geosci Remote Sens, 1992, 30: 261-270.
doi: 10.1109/36.134076 |
| [24] |
Huete A R, Liu H Q, Batchily K, van Leeuwen W. A comparison of vegetation indices over a global set of TM images for EOS-MODIS. Remote Sens Environ, 1997, 59: 440-451.
doi: 10.1016/S0034-4257(96)00112-5 |
| [25] |
Sims D A, Gamon J A. Relationships between leaf pigment content and spectral reflectance across a wide range of species, leaf structures and developmental stages. Remote Sens Environ, 2002, 81: 337-354.
doi: 10.1016/S0034-4257(02)00010-X |
| [26] |
Gamon J A, Peñuelas J, Field C B. A narrow-waveband spectral index that tracks diurnal changes in photosynthetic efficiency. Remote Sens Environ, 1992, 41: 35-44.
doi: 10.1016/0034-4257(92)90059-S |
| [27] |
Gitelson A, Merzlyak M N. Spectral reflectance changes associated with autumn senescence of Aesculus hippocastanum L. and Acer platanoides L. leaves. spectral features and relation to chlorophyll estimation. J Plant Physiol, 1994, 143: 286-292.
doi: 10.1016/S0176-1617(11)81633-0 |
| [28] |
Schlerf M, Atzberger C, Hill J. Remote sensing of forest biophysical variables using HyMap imaging spectrometer data. Remote Sens Environ, 2005, 95: 177-194.
doi: 10.1016/j.rse.2004.12.016 |
| [29] | 张华东, 阮陆宁. 偏最小二乘回归在R软件中的实现及其优缺点剖析. 科技广场, 2015, (11): 12-17. |
| Zhang H D, Ruan L N. Realization and advantages and disadvantages analysis of partial least-squares regression in the R software. Sci Mos, 2015, (11): 12-17. (in Chinese with English abstract) | |
| [30] | 王石言, 王力, 张静, 张林森. 黄土旱塬主要农林用地土壤水文特征对比. 中国水土保持科学, 2016, 14(3): 10-18. |
| Wang S Y, Wang L, Zhang J, Zhang L S. Comparison of soil hydrological characteristics for main cropland and orchard in dry highland of the Loess Tableland. Sci Soil Water Conserv, 2016, 14(3): 10-18. (in Chinese with English abstract) | |
| [31] |
Xie Y, Feng M, Wang C, Yang W, Sun H, Yang C, Jing B, Qiao X, Saleem Kubar M, Song J. Hyperspectral monitor on chlorophyll density in winter wheat under water stress. Agron J, 2020, 112: 3667-3676.
doi: 10.1002/agj2.v112.5 |
| [32] |
Liu J, Xie J, Meng T, Dong H. Organic matter estimation of surface soil using successive projection algorithm. Agron J, 2022, 114: 1944-1951.
doi: 10.1002/agj2.v114.4 |
| [33] |
Högy P, Kottmann L, Schmid I, Fangmeier A. Heat, wheat and CO2: the relevance of timing and the mode of temperature stress on biomass and yield. J Agron Crop Sci, 2019, 205: 608-615.
doi: 10.1111/jac.v205.6 |
| [34] |
Högy P, Brunnbauer M, Koehler P, Schwadorf K, Breuer J, Franzaring J, Zhunusbayeva D, Fangmeier A. Grain quality characteristics of spring wheat (Triticum aestivum) as affected by free-air CO2 enrichment. Environ Exp Bot, 2013, 88: 11-18.
doi: 10.1016/j.envexpbot.2011.12.007 |
| [35] |
Liu C, Hu Z H, Islam A, Kong R, Yu L F, Wang Y Y. Hyperspectral characteristics and inversion model estimation of winter wheat under different elevated CO2 concentrations. Int J Remote Sens, 2021, 42: 1035-1053.
doi: 10.1080/01431161.2020.1823038 |
| [36] | 杨熙来, 朱榴骏, 冯兆忠. 臭氧胁迫下冬小麦叶片高光谱特征和叶绿素含量估算. 生态学报, 2023, 43: 3213-3223. |
| Yang X L, Zhu L J, Feng Z Z. Hyperspectral characteristics and chlorophyll content estimation of winter wheat under ozone stress. Acta Ecol Sin, 2023, 43: 3213-3223. (in Chinese with English abstract) | |
| [37] |
Bandyopadhyay K K, Pradhan S, Sahoo R N, Singh R, Gupta V K, Joshi D K, Sutradhar A K. Characterization of water stress and prediction of yield of wheat using spectral indices under varied water and nitrogen management practices. Agric Water Manag, 2014, 146: 115-123.
doi: 10.1016/j.agwat.2014.07.017 |
| [38] |
Zhang C, Ren H, Dai X, Qin Q, Li J, Zhang T, Sun Y. Spectral characteristics of copper stressed vegetation leaves and further understanding of the copper stress vegetation index. Int J Remote Sens, 2019, 40: 4473-4488.
doi: 10.1080/01431161.2018.1563842 |
| [39] | Estrada F, Flexas J, Araus J L, Mora P F, Gonzalez T J, Castillo D, Matus I A, Méndez E A M, Garriga M, Araya R C, Douthe C, Castillo B, Del P A, Lobos G A. Exploring plant responses to abiotic stress by contrasting spectral signature changes. Front Plant Sci, 2023, 13: 1-17. |
| [40] |
Ohsowski B M, Dunfield K E, Klironomos J N, Hart M M. Improving plant biomass estimation in the field using partial least squares regression and ridge regression. Botany, 2016, 94: 501-508.
doi: 10.1139/cjb-2016-0009 |
| [41] |
Xie Y, Feng M, Wang C, Yang W, Sun H, Yang C, Jing B, Qiao X, Saleem K M, Song J. Hyperspectral monitor on chlorophyll density in winter wheat under water stress. Agron J, 2020, 112: 3667-3676.
doi: 10.1002/agj2.v112.5 |
| [1] | 赵荣荣, 丛楠, 赵闯. 基于Landsat 8影像提取豫中地区冬小麦和夏玉米分布信息的最佳时相选择[J]. 作物学报, 2024, 50(3): 721-733. |
| [2] | 谢炜, 贺鹏, 马宏亮, 雷芳, 黄秀兰, 樊高琼, 杨洪坤. 秋闲期秸秆覆盖与施磷对冬小麦氮素吸收利用的影响[J]. 作物学报, 2024, 50(2): 440-450. |
| [3] | 杨晓慧, 王碧胜, 孙筱璐, 侯靳锦, 徐梦杰, 王志军, 房全孝. 冬小麦对水分胁迫响应的模型模拟与节水滴灌制度优化[J]. 作物学报, 2023, 49(8): 2196-2209. |
| [4] | 刘世洁, 杨习文, 马耕, 冯昊翔, 韩志栋, 韩潇杰, 张晓燕, 贺德先, 马冬云, 谢迎新, 王丽芳, 王晨阳. 灌水和施氮对冬小麦根系特征及氮素利用的影响[J]. 作物学报, 2023, 49(8): 2296-2307. |
| [5] | 许乃银, 王扬, 王丹涛, 宁贺佳, 杨晓妮, 乔银桃. 棉花纤维质量指数的构建与WGT双标图分析[J]. 作物学报, 2023, 49(5): 1262-1271. |
| [6] | 张金鑫, 葛均筑, 马玮, 丁在松, 王新兵, 李从锋, 周宝元, 赵明. 华北平原冬小麦-夏玉米种植体系周年水分高效利用研究进展[J]. 作物学报, 2023, 49(4): 879-892. |
| [7] | 王雪, 谷淑波, 林祥, 王威雁, 张保军, 朱俊科, 王东. 微喷补灌水肥一体化对冬小麦产量及水分和氮素利用效率的影响[J]. 作物学报, 2023, 49(3): 784-794. |
| [8] | 高春华, 冯波, 李国芳, 李宗新, 李升东, 曹芳, 慈文亮, 赵海军. 施氮量对花后高温胁迫下冬小麦籽粒淀粉合成的影响[J]. 作物学报, 2023, 49(3): 821-832. |
| [9] | 孟雨, 田文仲, 温鹏飞, 丁志强, 张学品, 贺利, 段剑钊, 刘万代, 郭天财, 冯伟. 基于不同发育阶段协同的小麦品种抗旱性综合评判[J]. 作物学报, 2023, 49(2): 570-582. |
| [10] | 张翔宇, 胡鑫慧, 谷淑波, 林祥, 殷复伟, 王东. 减氮条件下分期施钾对冬小麦籽粒产量和氮素利用效率的影响[J]. 作物学报, 2023, 49(2): 447-458. |
| [11] | 周琦, 李岚涛, 张露露, 苗玉红, 王宜伦. 氮肥和播种量互作对冬小麦产量、生长发育和生态场特性的影响[J]. 作物学报, 2023, 49(11): 3100-3109. |
| [12] | 张艳艳, 关涵文, 刘淋茹, 贺利, 段剑钊, 王晨阳, 郭天财, 冯伟. 不同水分条件下施磷对冬小麦穗花发育及产量的影响[J]. 作物学报, 2023, 49(10): 2753-2765. |
| [13] | 陈嘉军, 林祥, 谷淑波, 王威雁, 张保军, 朱俊科, 王东. 花后叶面喷施尿素对冬小麦氮素吸收利用和产量的影响[J]. 作物学报, 2023, 49(1): 277-285. |
| [14] | 张少华, 段剑钊, 贺利, 井宇航, 郭天财, 王永华, 冯伟. 基于无人机平台多模态数据融合的小麦产量估算研究[J]. 作物学报, 2022, 48(7): 1746-1760. |
| [15] | 郭星宇, 刘朋召, 王瑞, 王小利, 李军. 旱地冬小麦产量、氮肥利用率及土壤氮素平衡对降水年型与施氮量的响应[J]. 作物学报, 2022, 48(5): 1262-1272. |
|