欢迎访问作物学报,今天是
作物学报 ›› 2024, Vol. 50 ›› Issue (10): 2614-2624.doi: 10.3724/SP.J.1006.2024.32057
张方亮1( ), 刘文英2, 田俊1, 汪建军2, 刘丹1, 杨军1, 李迎春1, 章毅之1,*()
ZHANG Fang-Liang1(), LIU Wen-Ying2, TIAN Jun1, WANG Jian-Jun2, LIU Dan1, YANG Jun1, LI Ying-Chun1, ZHANG Yi-Zhi1,*()
摘要:
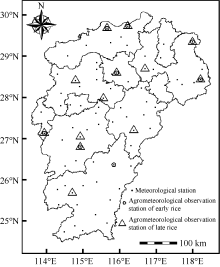
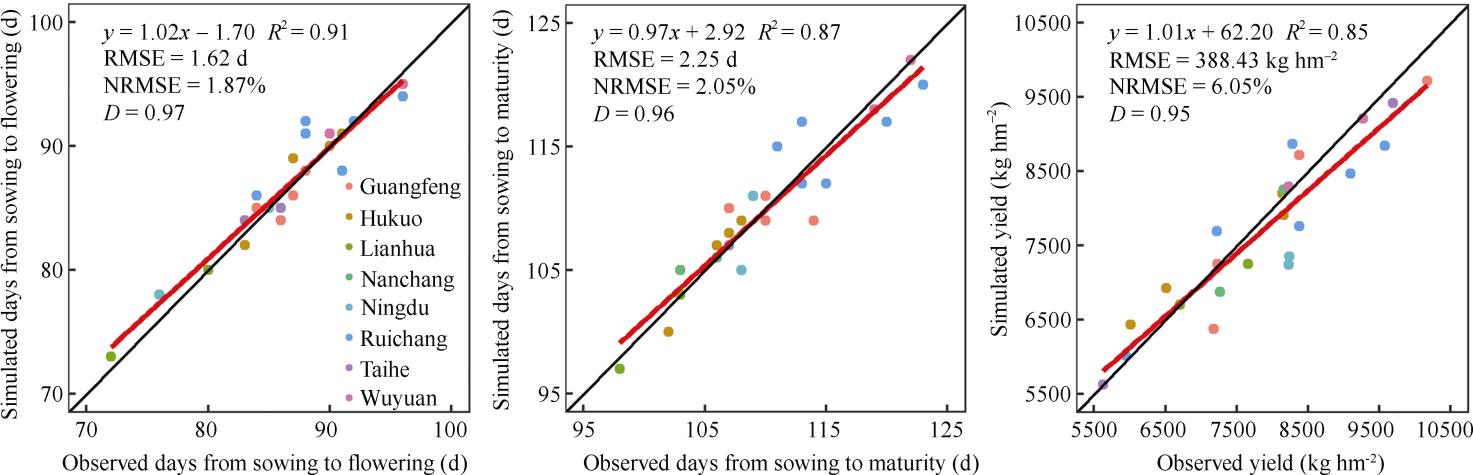
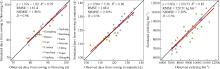
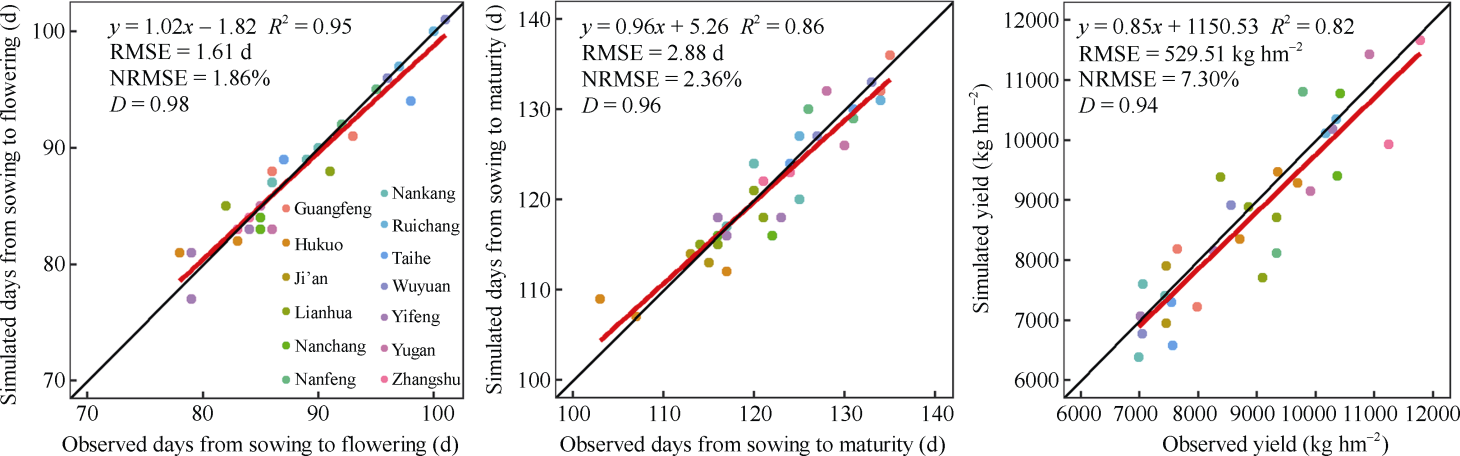
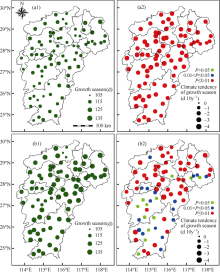
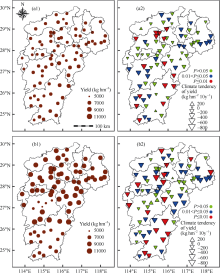
江西是中国双季稻的主要种植地区。气候变化严重影响了双季稻生产。基于江西省1981—2022年逐日气象资料和双季稻作物资料, 对DSSAT模型进行调参验证; 利用验证后的DSSAT模型, 分析江西省双季稻生长期和产量空间分布和时间变化趋势; 采用t检验方法, 明确气候变化对江西早稻和晚稻的影响差异。结果表明: (1) 江西早稻(晚稻)播种期至开花期天数、播种期至成熟期天数和产量模拟值与观测值的归一化均方根误差分别为1.87% (1.86%)、2.05% (2.36%)和6.05% (7.30%), D指标分别为0.97 (0.98)、0.96 (0.96)和0.95 (0.94); (2) 固定播期和品种条件下, 1981— 2022年江西早稻和晚稻生长期均呈显著缩短趋势, 平均每10年分别减少2.22 d和1.61 d; 研究期间江西早稻和晚稻潜在产量均呈显著下降趋势, 平均每10年分别减少181.30 kg hm-2和276.16 kg hm-2; (3) t检验表明, 江西早稻生长期气候倾向率极显著地小于晚稻, 而江西早稻潜在产量气候倾向率极显著地大于晚稻。DSSAT模型可较好的模拟江西双季稻生长发育和产量。气候变化对江西早稻生长期和晚稻潜在产量影响更加明显。本研究为江西双季稻作物模型研究、产量预报和气候变化评估提供了科学依据。
| [1] | 罗霄, 李忠武, 叶芳毅, 黄金权. 水稻生长模型CERES-Rice的研究进展及展望. 中国农业科技导报, 2009, 11(5): 54-59. |
| Luo X, Li Z W, Ye F Y, Huang J Q. Progress and prospects of studies on CERES-Rice models. J Agric Sci Technol, 2009, 11(5): 54-59 (in Chinese with English abstract). | |
| [2] | Xiong W, Holman I, Conway D, Lin E D, Li Y. A crop model cross calibration for use in regional climate impacts studies. Ecol Model, 2008, 213: 365-380. |
| [3] | 姚凤梅, 许吟隆, 冯强, 林而达, 延晓冬. CERES-Rice模型在中国主要水稻生态区的模拟及其检验. 作物学报, 2005, 31: 545-550. |
| Yao F M, Xu Y L, Feng Q, Lin E D, Yan X D. Simulation and validation of CERES-Rice model in main rice ecological zones in China. Acta Agron Sin, 2005, 31: 545-550 (in Chinese with English abstract). | |
| [4] | 熊伟. 站点CERES-Rice模型区域应用效果和误差来源. 生态学报, 2009, 29: 2003-2009. |
| Xiong W. The performance of regional simulation of CERES- Rice model and its uncertainties. Acta Ecol Sin, 2009, 29: 2003-2009 (in Chinese with English abstract). | |
| [5] | 胡家敏, 林忠辉, 向红琼, 徐永灵, 古书鸿. 基于CERES-Rice模型分析黔中高原水稻生产对气候变化的响应. 中国农业气象, 2011, 32(增刊1): 88-92. |
| Hu J M, Lin Z H, Xiang H Q, Xu Y L, Gu S H. Evaluation of the effects of climate change during the past 44 years on rice production in Guizhou plateau with CERES-Rice model. Chin J Agrometeorol, 2011, 32(S1): 88-92 (in Chinese with English abstract). | |
| [6] |
曹秀霞, 安开忠, 蔡伟, 苏荣瑞, 姚凤梅. CERES-Rice模型在江汉平原的验证与适应性评价. 中国农业气象, 2013, 34: 447-454.
doi: 10.3969/j.issn.1000-6362.2013.04.011 |
| Cao X X, An K Z, Cai W, Su R R, Yao F M. Validation and adaptability evaluation of CERES-Rice model in the Jianghan plain. Chin J Agrometeorol, 2013, 34: 447-454 (in Chinese with English abstract). | |
| [7] | 赖晨曦, 王莹, 张刘东, 王龙. 基于DSSAT模型不同灌水模式滇中水稻生长模拟. 江西农业学报, 2020, 32(5): 116-119. |
| Lai C X, Wang Y, Zhang L D, Wang L. Simulation of rice growth in central Yunnan in different watering patterns based on DSSAT model. Acta Agric Jiangxi, 2020, 32(5): 116-119 (in Chinese with English abstract). | |
| [8] | Zhang T Y, Huang Y, Yang X G. Climate warming over the past three decades has shortened rice growth duration in China and cultivar shifts have further accelerated the process for late rice. Global Chang Biol, 2013, 19: 563-570. |
| [9] | Zhang L L, Zhang Z, Zhang J, Luo Y C, Tao F L. Response of rice phenology to climate warming weakened across China during 1981-2018: did climatic or anthropogenic factors play a role? Environ Res Lett, 2022, 17: 064029. |
| [10] | Zhang S, Tao F L. Modeling the response of rice phenology to climate change and variability in different climatic zones: comparisons of five models. Eur J Agron, 2013, 45: 165-176. |
| [11] |
Nguyen-Sy T, Cheng W G, Tawaraya K, Sugawara K, Kobayashi K. Impacts of climatic and varietal changes on phenology and yield components in rice production in Shonai region of Yamagata Prefecture, Northeast Japan for 36 years. Plant Prod Sci, 2019, 22: 382-394.
doi: 10.1080/1343943X.2019.1571421 |
| [12] | Yoon P R, Choi J Y. Effects of shift in growing season due to climate change on rice yield and crop water requirements. Paddy Water Environ, 2020, 18: 291-307. |
| [13] | Cai C Z, Yang H Y, Zhang L, Cao W F. Potential yield of world rice under global warming based on the ARIMA-TR model. Atmosphere, 2022, 13: 1336. |
| [14] |
Peng S B, Huang J L, Sheehy J E, Laza R C, Visperas R M, Zhong X H, Centeno G S, Khush G S, Cassman K G. Rice yields decline with higher night temperature from global warming. Proc Natl Acad Sci USA, 2004, 101: 9971-9975.
doi: 10.1073/pnas.0403720101 pmid: 15226500 |
| [15] | Zhang L J, Wang J X, Sun T H, Wang X L. Impacts of climate change on the mean and variance of indica and japonica rice yield in China. Agronomy, 2022, 12: 3062. |
| [16] | 熊伟, 陶福禄, 许吟隆, 林而达. 气候变化情景下我国水稻产量变化模拟. 中国农业气象, 2001, 22(3): 1-5. |
| Xiong W, Tao F L, Xu Y L, Lin E D. Simulation of rice yield under climatic changes in future in China. Chin J Agrometeorol, 2001, 22(3): 1-5 (in Chinese with English abstract). | |
| [17] | Nasir I R, Rasul F, Ahmad A, Asghar H N, Hoogenboom G. Climate change impacts and adaptations for fine, coarse, and hybrid rice using CERES-Rice. Environ Sci Pollut Res Int, 2020, 27: 9454-9464. |
| [18] | Babel M, Agarwal A, Swain D, Herath S. Evaluation of climate change impacts and adaptation measures for rice cultivation in northeast Thailand. Clim Res, 2011, 46: 137-146. |
| [19] | 中华人民共和国国家统计局. 中国统计年鉴. 北京: 中国统计出版社, 2022. pp 255-288. |
| National Bureau of Statistics of the People’s Republic of China. China Statistical Yearbook. Beijing: China Statistics Press, 2022. pp 255-288 (in Chinese). | |
| [20] | 江西省统计局. 江西省统计年鉴. 北京: 中国统计出版社, 2022. pp 255-288. |
| Jiangxi Provincial Bureau of Statistics. Jiangxi Provincial Statistical Yearbook. Beijing: China Statistics Press, 2022. pp 255-288 (in Chinese). | |
| [21] | Allen R G, Pereira L S, Raes D, Smith M. Crop Evapotranspiration-Guidelines for Computing Crop Water Requirements-FAO Irrigation and Drainage Paper 56. Rome: Food and Agriculture Organization of the United Nations, 1998. pp 50-64. |
| [22] | Hoogenboom G, Wilkens P W, Tsuji G Y. DSSAT v3, Volume 1. Honolulu, Hawaii: University of Hawaii, 1999. pp 1-15. |
| [23] | Jones J W, Hoogenboom G, Porter C H, Boote K J, Batchelor W D, Hunt L A, Wilkens P W, Singh U, Gijsman A J, Ritchie J T. The DSSAT cropping system model. Eur J Agron, 2003, 18: 235-265. |
| [24] | Jones J W, Hoogenboom G, Wilkens P W, Porter C H, Tsuji G Y. Decision Support System for Agrotechnology Transfer Version 4.0. Volume 4. dssat v4.5: Crop Model Documentation. Honolulu: University of Hawaii, 2010. pp 1-9. |
| [25] | Hoogenboom G, Porter C H, Shelia V, Boote K J, Singh U. Decision Support System for Agrotechnology Transfer (DSSAT) Version 4.8.2. Gainesville, Florida, USA: DSSAT Foundation, 2024. pp 55-77. |
| [26] | Yang J M, Yang J Y, Liu S, Hoogenboom G. An evaluation of the statistical methods for testing the performance of crop models with observed data. Agric Syst, 2014, 127: 81-89. |
| [27] |
郭尔静, 杨晓光, 王晓煜, 张天一, 黄晚华, 刘子琪, Tao L. 湖南省双季稻产量差时空分布特征. 中国农业科学, 2017, 50: 399-412.
doi: 10.3864/j.issn.0578-1752.2017.02.018 |
| Guo E J, Yang X G, Wang X Y, Zhang T Y, Huang W H, Liu Z Q, Tao L. Spatial-temporal distribution of double cropping rice’s yield gap in Hunan province. Sci Agric Sin, 2017, 50: 399-412 (in Chinese with English abstract). | |
| [28] | Evans L T, Fischer R A. Yield potential: its definition, measurement, and significance. Crop Sci, 1999, 39: 1544-1551. |
| [29] | 魏凤英. 现代气候统计诊断与预测技术, 第2版. 北京: 气象出版社, 2007. pp 42-59. |
| Wei F Y. Modern Climate Statistical Diagnosis and Prediction Technology, 2nd edn. Beijing: China Meteorological Press, 2007. pp 42-59 (in Chinese). | |
| [30] | 穆宝胜, 刘欣, 朱文艳. 基于N个标准差法和箱线图法识别变形监测中异常值的应用探究. 南通职业大学学报, 2023, 37(2): 100-104. |
| Mu B S, Liu X, Zhu W Y. Application of processing abnormal values in deformation monitoring based on N-standard-deviation method and boxplot method. J Nantong Vocat Univ, 2023, 37(2): 100-104 (in Chinese with English abstract). | |
| [31] | 赵超. 降雨异常值探测的改造箱形图法. 中国农村水利水电, 2012, (9): 60-62. |
| Zhao C. An adjusted boxplot for rainfall observations. China Rural Water Hydropower, 2012, (9): 60-62 (in Chinese with English abstract). | |
| [32] | Timsina J, Humphreys E. Performance of CERES-Rice and CERES-Wheat models in rice-wheat systems: a review. Agric Syst, 2006, 90: 5-31. |
| [33] | IPCC. Climate change 2021: the Physical Science Basis. Cambridge, United Kingdom and New York, USA: Cambridge University Press, 2021. pp 1-40. |
| [34] |
凌霄霞, 张作林, 翟景秋, 叶树春, 黄见良. 气候变化对中国水稻生产的影响研究进展. 作物学报, 2019, 45: 323-334.
doi: 10.3724/SP.J.1006.2019.82044 |
| Ling X X, Zhang Z L, Zhai J Q, Ye S C, Huang J L. A review for impacts of climate change on rice production in China. Acta Agron Sin, 2019, 45: 323-334 (in Chinese with English abstract). | |
| [35] | 王学林, 曾凯, 柳军, 谢金花, 张玉龙, 邓斌. 长江中下游地区双季稻生长季内热量资源的变化特征及温度适宜度分析. 西北农林科技大学学报(自然科学版), 2021, 49(3): 27-37. |
| Wang X L, Zeng K, Liu J, Xie J H, Zhang Y L, Deng B. Variation characteristics of heat resources and temperature suitability for double cropping rice growing seasons in the middle and lower reaches of Yangtze river. J Northwest A&F Univ (Nat Sci Edn), 2021, 49(3): 27-37 (in Chinese with English abstract). | |
| [36] | Liu L L, Wang E L, Zhu Y, Tang L, Cao W X. Effects of warming and autonomous breeding on the phenological development and grain yield of double-rice systems in China. Agric Ecosyst Environ, 2013, 165: 28-38. |
| [37] | Wang X H, Ciais P, Li L, Ruget F, Vuichard N, Viovy N, Zhou F, Chang J F, Wu X C, Zhao H F, Piao S L. Management outweighs climate change on affecting length of rice growing period for early rice and single rice in China during 1991-2012. Agric Forest Meteorol, 2017, 233: 1-11. |
| [38] | Ye T, Zong S, Kleidon A, Yuan W P, Wang Y, Shi P J. Impacts of climate warming, cultivar shifts, and phenological dates on rice growth period length in China after correction for seasonal shift effects. Clim Change, 2019, 155: 127-143. |
| [39] | Lyu Z F, Zhu Y, Liu X J, Ye H B, Tian Y C, Li F F. Climate change impacts on regional rice production in China. Clim Change, 2018, 147: 523-537. |
| [1] | 刘二华, 周广胜, 武炳义, 宋艳玲, 何奇瑾, 吕晓敏, 周梦子. 1981—2010年长江中下游地区单季稻生殖生长期对气候变化和技术进步的响应[J]. 作物学报, 2023, 49(5): 1305-1315. |
| [2] | 柯健, 陈婷婷, 吴周, 朱铁忠, 孙杰, 何海兵, 尤翠翠, 朱德泉, 武立权. 沿江双季稻北缘区晚稻适宜品种类型及高产群体特征[J]. 作物学报, 2022, 48(4): 1005-1016. |
| [3] | 冯向前, 殷敏, 王孟佳, 马横宇, 刘元辉, 褚光, 徐春梅, 章秀福, 王丹英, 张运波, 陈松. 播期对长江下游不同类型晚稻品种产量的影响及其与水稻全育期温光资源配置间关系[J]. 作物学报, 2022, 48(10): 2597-2613. |
| [4] | 王亚梁, 朱德峰, 张玉屏, 陈若霞, 向镜, 陈惠哲, 谌江华, 汪峰. 连作杂交晚稻精准条播长秧龄机插的生长及产量特性分析[J]. 作物学报, 2022, 48(1): 215-225. |
| [5] | 唐健,唐闯,郭保卫,张诚信,张振振,王科,张洪程,陈恒,孙明珠. 氮肥施用量对机插优质晚稻产量和稻米品质的影响[J]. 作物学报, 2020, 46(01): 117-130. |
| [6] | 吕伟生,曾勇军*,石庆华,潘晓华,黄山,商庆银,谭雪明,李木英,胡水秀. 机插早稻分蘖成穗特性及基本苗公式参数研究[J]. 作物学报, 2016, 42(03): 427-436. |
| [7] | 郭保卫,花劲,周年兵,张洪程,陈波,舒鹏,霍中洋,周培建,程飞虎,黄大山,陈忠平,陈国梁,陈恒,戴其根,许轲,魏海燕,高辉. 双季晚稻不同类型品种产量及其群体动态特征差异研究[J]. 作物学报, 2015, 41(08): 1220-1236. |
| [8] | 曾勇军,吕伟生,潘晓华,朱德峰,谭雪明,黄山,商庆银,石庆华. 氮肥追施方法和追用时期对超级早稻株型及物质生产的影响[J]. 作物学报, 2014, 40(11): 2008-2015. |
| [9] | 徐建文,梅旭荣,居辉,李迎春,刘勤,杨建莹. 黄淮海地区冬小麦关键生育期不同灌溉水平对产量影响的模拟[J]. 作物学报, 2014, 40(08): 1485-1492. |
| [10] | 唐海明,汤文光,肖小平,罗尊长,张帆,汪柯,杨光立. 冬种黑麦草对6种水稻土重金属含量及晚稻不同器官重金属累积与分配的影响[J]. 作物学报, 2012, 38(06): 1121-1126. |
| [11] | 袁小乐,潘晓华,石庆华,吴建富,漆映雪. 超级早、晚稻品种的源库协调性[J]. 作物学报, 2009, 35(9): 1744-1748. |
| [12] | 张久权;张凌霄;张明华;WATSON Clarence. 应用神经网络和统计模型预测大豆生长发育阶段[J]. 作物学报, 2009, 35(2): 341-347. |
| [13] | 曾勇军;石庆华;潘晓华;韩涛. 施氮量对高产早稻氮素利用特征及产量形成的影响[J]. 作物学报, 2008, 34(08): 1409-1416. |
| [14] | 肖小平;汤海涛;纪雄辉. 稻草还田模式对稻田土壤速效氮、钾含量及晚稻生长的影响[J]. 作物学报, 2008, 34(08): 1464-1469. |
| [15] | 石庆华;李木英;许锦彪;谭雪明. 高温胁迫对早稻根系质膜ATPase活性及NH4+吸收的影响[J]. 作物学报, 2006, 32(07): 1044-1048. |
|