欢迎访问作物学报,今天是
作物学报 ›› 2025, Vol. 51 ›› Issue (5): 1389-1399.doi: 10.3724/SP.J.1006.2025.43050
周科1,2( ), 陈鹏飞1,3,*()
ZHOU Ke1,2(), CHEN Peng-Fei1,3,*()
摘要:
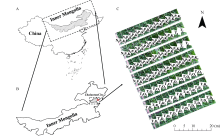
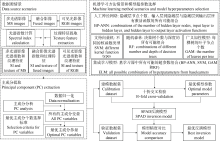
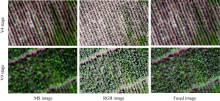
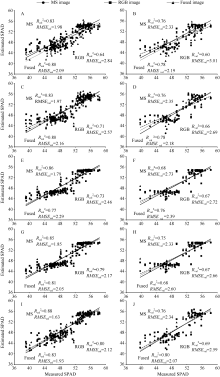
为实现玉米精准施肥管理, 准确识别其叶绿素含量具有重要意义。叶片叶绿素相对含量(soil and plant analyzer development, SPAD)值是叶绿素含量的重要指示参数, 已有研究多采用单一数据源, 结合单一机器学习方法来对其反演。为提高SPAD反演精度, 本研究探讨耦合多源无人机遥感影像与多种机器学习方法来开展SPAD值反演的可行性, 并将其与已有方法进行比较。基于不同有机肥、无机肥、秸秆还田以及种植密度处理的玉米田间试验, 获取玉米四叶期和九叶期的无人机多光谱影像和RGB (red-green-blue)影像, 并同步测量了叶片SPAD数据。基于多尺度分析的方法, 将RGB影像与多光谱影像进行融合, 生成既具有高空间分辨率又具有多光谱的融合影像。此外, 基于集成学习思想, 选择BP-人工神经网络法(back propagation-artificial neural network, BP-ANN)、支持向量机法(support vector machine, SVM)、广义加性模型法(generalized additive model, GAM)、随机森林法(random forest, RF)等不同类型机器学习模型, 构建集成学习模型(ensemble learning method, ELM)。基于以上数据源和模型, 设计不同数据源和不同机器学习模型的耦合情景。将数据集分为建模数据集和验证数据集, 基于建模数据集构建每种情景下的SPAD反演模型, 然后基于验证数据集进行模型验证, 对比分析确定最优SPAD反演模型与数据源。相对于单源数据, 多源数据通过融合多光谱影像的光谱信息和RGB影像的纹理信息, 提高了SPAD反演的精度。此外, 相对于单一机器学习方法, 基于集成学习思想耦合多种机器学习方法可以提高SPAD的反演精度。在所有情景中, 基于ELM方法和融合影像的SPAD模型精度最高, 其建模Rcal2为0.83、RMSEcal为1.93, 验证Rval2为0.80、RMSEval为2.07; 其他情景下, 各模型的建模Rcal2在0.64~0.88之间, RMSEcal在1.63~2.84之间; 验证Rval2在0.60~0.78之间, RMSEval在2.18~3.01之间。本研究证明了在反演玉米SPAD时, 最优策略是使用多源数据和集成学习模型, 为进一步的精准氮肥管理提供了技术支撑。
| [1] |
李少昆, 赵久然, 董树亭, 赵明, 李潮海, 崔彦宏, 刘永红, 高聚林, 薛吉全, 王立春, 等. 中国玉米栽培研究进展与展望. 中国农业科学, 2017, 50: 1941-1959.
doi: 10.3864/j.issn.0578-1752.2017.11.001 |
|
Li S K, Zhao J R, Dong S T, Zhao M, Li C H, Cui Y H, Liu Y H, Gao J L, Xue J Q, Wang L C, et al. Advances and prospects of maize cultivation in China. Sci Agric Sin, 2017, 50: 1941-1959 (in Chinese with English abstract).
doi: 10.3864/j.issn.0578-1752.2017.11.001 |
|
| [2] |
魏廷邦, 柴强, 王伟民, 王军强. 水氮耦合及种植密度对绿洲灌区玉米光合作用和干物质积累特征的调控效应. 中国农业科学, 2019, 52: 428-444.
doi: 10.3864/j.issn.0578-1752.2019.03.004 |
|
Wei T B, Chai Q, Wang W M, Wang J Q. Effects of coupling of irrigation and nitrogen application as well as planting density on photosynthesis and dry matter accumulation characteristics of maize in oasis irrigated areas. Sci Agric Sin, 2019, 52: 428-444 (in Chinese with English abstract).
doi: 10.3864/j.issn.0578-1752.2019.03.004 |
|
| [3] | 陈志强, 王磊, 白由路, 杨俐苹, 卢艳丽, 王贺, 王志勇. 整个生育期玉米叶片SPAD高光谱预测模型研究. 光谱学与光谱分析, 2013, 33: 2838-2842. |
| Chen Z Q, Wang L, Bai Y L, Yang L P, Lu Y L, Wang H, Wang Z Y. Hyperspectral prediction model for maize leaf SPAD in the whole growth period. Spectrosc Spectr Anal, 2013, 33: 2838-2842 (in Chinese with English abstract). | |
| [4] | 徐若涵, 杨再强, 申梦吟, 王明田. 苗期低温胁迫对“红颜”草莓叶绿素含量及冠层高光谱的影响. 中国农业气象, 2022, 43: 148-158. |
| Xu R H, Yang Z Q, Shen M Y, Wang M T. Effects of low temperature stress at seedling stage on chlorophyll content and canopy hyperspectral of “hongyan” strawberry. Chin J Agrometeorol, 2022, 43: 148-158 (in Chinese with English abstract). | |
| [5] | Chen P F, Ma X. Optimal strategy for designing a multitask learning-based hybrid model to predict wheat leaf nitrogen content. IEEE Geosci Remote Sens Lett, 2023, 20: 2504805. |
| [6] | Guo Y H, Chen S Z, Li X X, Cunha M, Jayavelu S, Cammarano D, Fu Y S. Machine learning-based approaches for predicting SPAD values of maize using multi-spectral images. Remote Sens, 2022, 14: 1337. |
| [7] | Wang J J, Zhou Q, Shang J L, Liu C, Zhuang T X, Ding J J, Xian Y Y, Zhao L T, Wang W L, Zhou G S, et al. UAV-and machine learning-based retrieval of wheat SPAD values at the overwintering stage for variety screening. Remote Sens, 2021, 13: 5166. |
| [8] | Ma W T, Han W T, Zhang H H, Cui X, Zhai X D, Zhang L Y, Shao G M, Niu Y X, Huang S J. UAV multispectral remote sensing for the estimation of SPAD values at various growth stages of maize under different irrigation levels. Comput Electron Agric, 2024, 227: 109566. |
| [9] | 车荧璞, 王庆, 李世林, 李保国, 马韫韬. 基于超分辨率重建和多模态数据融合的玉米表型性状监测. 农业工程学报, 2021, 37(20): 169-178. |
| Che Y P, Wang Q, Li S L, Li B G, Ma Y T. Monitoring of maize phenotypic traits using super-resolution reconstruction and multimodal data fusion. Trans CSAE, 2021, 37(20): 169-178 (in Chinese with English abstract). | |
| [10] | Xu S Z, Xu X G, Zhu Q Z, Meng Y, Yang G J, Feng H K, Yang M, Zhu Q L, Xue H Y, Wang B B. Monitoring leaf nitrogen content in rice based on information fusion of multi-sensor imagery from UAV. Precis Agric, 2023, 24: 2327-2349. |
| [11] | Du R Q, Lu J S, Xiang Y Z, Zhang F C, Chen J Y, Tang Z J, Shi H Z, Wang X, Li W Y. Estimation of winter canola growth parameter from UAV multi-angular spectral-texture information using stacking-based ensemble learning model. Comput Electron Agric, 2024, 222: 109074. |
| [12] |
马俊伟, 陈鹏飞, 孙毅, 谷健, 王李娟. 基于无人机多光谱影像和机器学习方法的玉米叶面积指数反演研究. 作物学报, 2023, 49: 3364-3376.
doi: 10.3724/SP.J.1006.2023.33001 |
| Ma J W, Chen P F, Sun Y, Gu J, Wang L J. Comparing different machine learning methods for maize leaf area index (LAI) prediction using multispectral image from unmanned aerial vehicle (UAV). Acta Agron Sin, 2023, 49: 3364-3376 (in Chinese with English abstract). | |
| [13] | Loncan L, de Almeida L B, Bioucas-Dias J M, Briottet X, Chanussot J, Dobigeon N, Fabre S, Liao W Z, Licciardi G A, Simões M, et al. Hyperspectral pansharpening: a review. IEEE Geosci Remote Sens Mag, 2015, 3: 27-46. |
| [14] | Selva M, Aiazzi B, Butera F, Chiarantini L, Baronti S. Hyper-sharpening: a first approach on SIM-GA data. IEEE J Sel Top Appl Earth Obs Remote Sens, 2015, 8: 3008-3024. |
| [15] | Richardson M D, Karcher D E, Purcell L C. Quantifying turfgrass cover using digital image analysis. Crop Sci, 2001, 41: 1884-1888. |
| [16] | Chen P F, Wang F Y. New textural indicators for assessing above-ground cotton biomass extracted from optical imagery obtained via unmanned aerial vehicle. Remote Sens, 2020, 12: 4170. |
| [17] | Pearson R L, Miller L D. Remote mapping of standing crop biomass for estimation of the productivity of the shortgrass prairie. Remote Sens Environ, 1972, 8: 1355. |
| [18] | Huete A, Didan K, Miura T, Rodriguez E P, Gao X, Ferreira L G. Overview of the radiometric and biophysical performance of the MODIS vegetation indices. Remote Sens Environ, 2002, 83: 195-213. |
| [19] | Broge N H, Leblanc E. Comparing prediction power and stability of broadband and hyperspectral vegetation indices for estimation of green leaf area index and canopy chlorophyll density. Remote Sens Environ, 2001, 76: 156-172. |
| [20] | Chen J M. Evaluation of vegetation indices and a modified simple ratio for boreal applications. Can J Remote Sens, 1996, 22: 229-242. |
| [21] | Rouse J, Haas R H, Schell J A, Deering D. Monitoring vegetation systems in the great Plains with ERTS. NASA Spec Publ, 1974, 351: 309. |
| [22] | Huete A, Justice C, Liu H. Development of vegetation and soil indices for MODIS-EOS. Remote Sens Environ, 1994, 49: 224-234. |
| [23] | Fitzgerald G J, Rodriguez D, Christensen L K, Belford R, Sadras V O, Clarke T R. Spectral and thermal sensing for nitrogen and water status in rainfed and irrigated wheat environments. Precis Agric, 2006, 7: 233-248. |
| [24] | Gitelson A A, Viña A, Ciganda V, Rundquist D C, Arkebauer T J. Remote estimation of canopy chlorophyll content in crops. Geophys Res Lett, 2005, 32: L08403. |
| [25] |
Feng W, Wu Y P, He L, Ren X X, Wang Y Y, Hou G G, Wang Y H, Liu W D, Guo T C. An optimized non-linear vegetation index for estimating leaf area index in winter wheat. Precis Agric, 2019, 20: 1157-1176.
doi: 10.1007/s11119-019-09648-8 |
| [26] | Reyniers M, Walvoort D J J, De Baardemaaker J. A linear model to predict with a multi-spectral radiometer the amount of nitrogen in winter wheat. Int J Remote Sens, 2006, 27: 4159-4179. |
| [27] | Gitelson A A, Kaufman Y J, Stark R, Rundquist D. Novel algorithms for remote estimation of vegetation fraction. Remote Sens Environ, 2002, 80: 76-87. |
| [28] | Rondeaux G, Steven M, Baret F. Optimization of soil-adjusted vegetation indices. Remote Sens Environ, 1996, 55: 95-107. |
| [29] | Daughtry C S T, Walthall C L, Kim M S, de Colstoun E B, McMurtrey J E. Estimating corn leaf chlorophyll concentration from leaf and canopy reflectance. Remote Sens Environ, 2000, 74: 229-239. |
| [30] | Dash J, Curran P J. Evaluation of the MERIS terrestrial chlorophyll index (MTCI). Adv Space Res, 2007, 39: 100-104. |
| [31] | Meyer G E, Neto J C. Verification of color vegetation indices for automated crop imaging applications. Comput Electron Agric, 2008, 63: 282-293. |
| [32] | Hunt E R, Cavigelli M, Daughtry C S T T, McMurtrey J E, Walthall C L. Evaluation of digital photography from model aircraft for remote sensing of crop biomass and nitrogen status. Precis Agric, 2005, 6: 359-378. |
| [33] | Kawashima S, Nakatani M. An algorithm for estimating chlorophyll content in leaves using a video camera. Ann Bot, 1998, 81: 49-54. |
| [34] | Bendig J, Yu K, Aasen H, Bolten A, Bennertz S, Broscheit J, Gnyp M L, Bareth G. Combining UAV-based plant height from crop surface models, visible, and near infrared vegetation indices for biomass monitoring in barley. Int J Appl Earth Obs Geoinf, 2015, 39: 79-87. |
| [35] | Guijarro M, Pajares G, Riomoros I, Herrera P J, Burgos-Artizzu X P, Ribeiro A. Automatic segmentation of relevant textures in agricultural images. Comput Electron Agric, 2011, 75: 75-83. |
| [36] | Haboudane D, Tremblay N, Miller J R, Vigneault P. Remote estimation of crop chlorophyll content using spectral indices derived from hyperspectral data. IEEE Trans Geosci Remote Sens, 2008, 46: 423-437. |
| [37] | Farifteh J, Van der Meer F, Atzberger C, Carranza E J M. Quantitative analysis of salt-affected soil reflectance spectra: a comparison of two adaptive methods (PLSR and ANN). Remote Sens Environ, 2007, 110: 59-78. |
| [38] | Lou Y, Caruana R, Gehrke J. Intelligible models for classification and regression. Proceedings of the 18th ACM SIGKDD International Conference on Knowledge Discovery and Data Mining. Beijing, China. ACM, 2012. pp 150-158. |
| [39] | Wu Q, Zhang Y P, Zhao Z W, Xie M, Hou D Y. Estimation of relative chlorophyll content in spring wheat based on multi-temporal UAV remote sensing. Agronomy, 2023, 13: 211. |
| [40] | Sudu B, Rong G Z, Guga S R, Li K W, Zhi F, Guo Y, Zhang J Q, Bao Y L. Retrieving SPAD values of summer maize using UAV hyperspectral data based on multiple machine learning algorithm. Remote Sens, 2022, 14: 5407. |
| [41] |
Seager S, Turner E L, Schafer J, Ford E B. Vegetation’s red edge: a possible spectroscopic biosignature of extraterrestrial plants. Astrobiology, 2005, 5: 372-390.
pmid: 15941381 |
| [42] | Tsuchikawa S, Ma T, Inagaki T. Application of near-infrared spectroscopy to agriculture and forestry. Anal Sci, 2022, 38: 635-642. |
| [43] | 苏伟, 王伟, 刘哲, 张明政, 边大红, 崔彦宏, 黄健熙. 无人机影像反演玉米冠层LAI和叶绿素含量的参数确定. 农业工程学报, 2020, 36(19): 58-65. |
| Su W, Wang W, Liu Z, Zhang M Z, Bian D H, Cui Y H, Huang J X. Determining the retrieving parameters of corn canopy LAI and chlorophyll content computed using UAV image. Trans CSAE, 2020, 36(19): 58-65 (in Chinese with English abstract). | |
| [44] | Li W F, Pan K, Liu W R, Xiao W H, Ni S J, Shi P, Chen X Y, Li T. Monitoring maize canopy chlorophyll content throughout the growth stages based on UAV MS and RGB feature fusion. Agriculture, 2024, 14: 1265. |
| [45] |
张鹏, 王砚涵, 吴强, 李赛如, 张永平. 基于无人机多光谱影像的春小麦SPAD值估测研究. 北方农业学报, 2024, 52(4): 120-134.
doi: 10.12190/j.issn.2096-1197.2024.04.13 |
| Zhang P, Wang Y H, Wu Q, Li S R, Zhang Y P. Research on SPAD value estimation of spring wheat based on UAV multispectral imager. J North Agric, 2024, 52(4): 120-134 (in Chinese with English abstract). |
| [1] | 蒋雨洲, 王甲, 张宏媛, 冯文豪, 王鹏, 李玉义. 化肥配施有机物料对玉米田土壤细菌和真菌群落结构的影响[J]. 作物学报, 2025, 51(5): 1378-1388. |
| [2] | 盛倩男, 方娅婷, 赵剑, 杜思垚, 胡行珍, 余秋华, 朱俊, 任涛, 鲁剑巍. 不同养分管理措施对稻田和旱地油菜产量的影响及其对冻害的响应[J]. 作物学报, 2025, 51(5): 1286-1298. |
| [3] | 孟凡琦, 房孟颖, 罗艺, 卢霖, 董学瑞, 王亚菲, 郭丽娜, 闫鹏, 董志强, 张凤路. 乙烯利-甜菜碱-水杨酸合剂对夏玉米耐热性和产量的调控效应[J]. 作物学报, 2025, 51(5): 1299-1311. |
| [4] | 宋利, 刘广周, 张华, 卢庭启, 卿春燕, 杨云山, 郭晓霞, 胡单, 李少昆, 侯鹏. 密植滴灌水肥一体化对西南夏玉米产量及土壤细菌群落的影响[J]. 作物学报, 2025, 51(4): 992-1004. |
| [5] | 李雪婷, 任昊, 王洪章, 张吉旺, 赵斌, 任佰朝, 刘莹, 姚海燕, 刘鹏. 盐胁迫对不同耐盐型玉米品种叶片光合性能和干物质积累与分配的影响[J]. 作物学报, 2025, 51(4): 1091-1101. |
| [6] | 王岩, 白春生, 李波, 范虹, 何蔚, 杨莉莉, 曹悦, 赵财. 覆膜免耕和灌水量对西北绿洲灌区玉米产量及光合特性的影响[J]. 作物学报, 2025, 51(3): 755-770. |
| [7] | 李翔宇, 季欣杰, 王雪莲, 龙安燃, 王峥宇, 杨子慧, 宫香伟, 姜英, 齐华. 秸秆还田配施氮肥对春玉米产量和籽粒品质的影响[J]. 作物学报, 2025, 51(3): 696-712. |
| [8] | 辛雨宁, 任昊, 王洪章, 梁明磊, 于涛, 刘鹏. 喷施6-苄氨基腺嘌呤(6-BA)对授粉后高温胁迫下夏玉米籽粒灌浆及产量的影响[J]. 作物学报, 2025, 51(2): 418-431. |
| [9] | 陈琛, 付修义, 陈传永, 吴珊珊, 张华生, 张春原, 陈绍江, 赵久然, 王元东. 不同玉米自交系的单倍体育种性能研究[J]. 作物学报, 2025, 51(2): 526-533. |
| [10] | 钱玉平, 宿兵兵, 高吉星, 阮粉花, 李亚伟, 茅林春. 玉米大豆间作对喀斯特区土壤理化性质及微生物碳代谢特征的影响[J]. 作物学报, 2025, 51(1): 273-284. |
| [11] | 郝琪, 陈天陆, 王富贵, 王振, 白岚方, 王永强, 王志刚. 基于无人机多光谱数据和氮素空间分异的玉米冠层氮浓度估算[J]. 作物学报, 2025, 51(1): 189-206. |
| [12] | 叶靓, 朱叶琳, 裴琳婧, 张思颖, 左雪倩, 李正真, 刘芳, 谭静. 联合全基因组关联和转录组分析筛选玉米拟轮枝镰孢穗腐病的抗性候选基因[J]. 作物学报, 2024, 50(9): 2279-2296. |
| [13] | 孙照华, 任昊, 王洪章, 王子强, 姚海燕, 辛爱美, 赵斌, 张吉旺, 任佰朝, 刘鹏. 叶面喷施硅制剂对滨海盐碱地夏玉米叶片光合性能及籽粒产量的影响[J]. 作物学报, 2024, 50(9): 2383-2395. |
| [14] | 郭思语, 赵克勇, 代正罡, 邹华文, 吴忠义, 张春. 玉米N-乙酰转移酶ZmNAT1基因响应非生物胁迫的功能分析[J]. 作物学报, 2024, 50(8): 2001-2013. |
| [15] | 曹晓晴, 祁显涛, 刘昌林, 谢传晓. 编辑ZmCCT10、ZmCCT9、ZmGhd7基因的串联DsRed荧光表达盒的CRISPR/Cas9系统的构建及验证[J]. 作物学报, 2024, 50(8): 1961-1970. |
|
||