欢迎访问作物学报,今天是
作物学报 ›› 2018, Vol. 44 ›› Issue (11): 1704-1712.doi: 10.3724/SP.J.1006.2018.01704
王小慧1,姜雨林1,刘洋1,卢捷1,尹小刚1,史磊刚2,黄晶3,褚庆全1,陈阜1,*( )
)
Xiao-Hui WANG1,Yu-Lin JIANG1,Yang LIU1,Jie LU1,Xiao-Gang YIN1,Lei-Gang SHI2,Jing HUANG3,Qing-Quan CHU1,Fu CHEN1,*()
摘要:
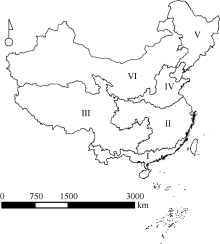
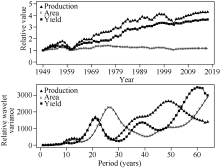
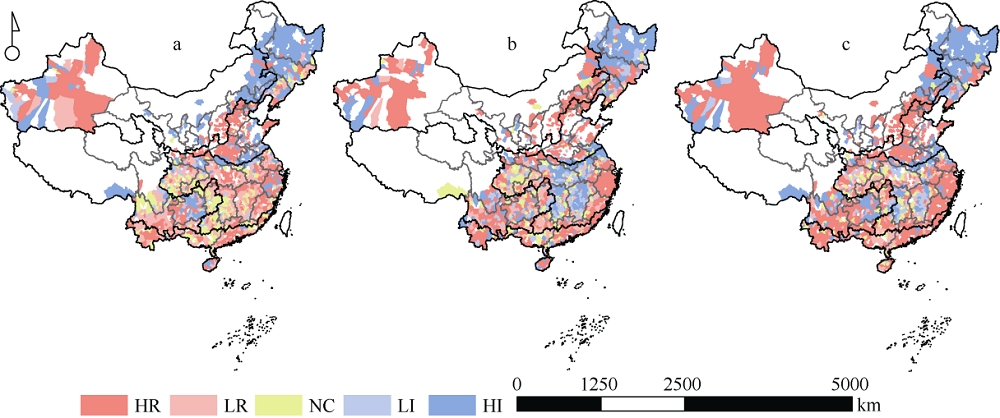
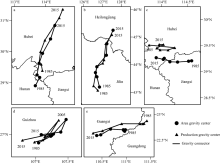
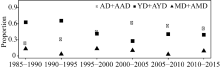
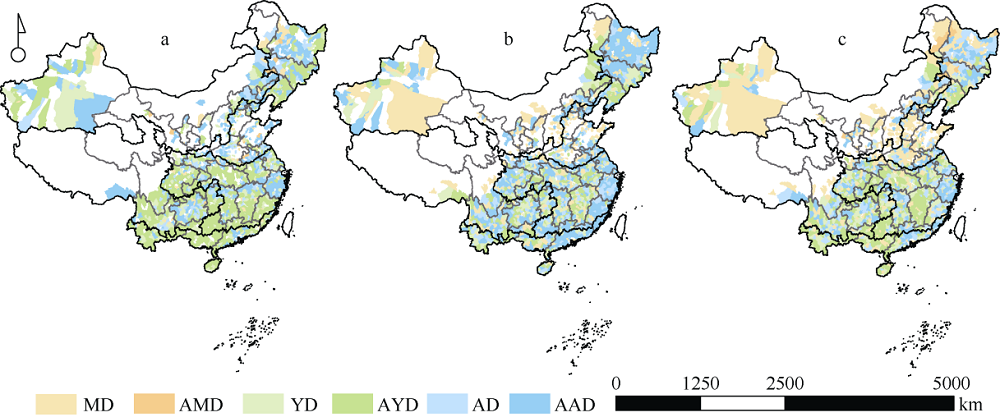
水稻是我国最重要的粮食作物之一, 阐明近几十年来水稻的时空动态变化特征, 对于优化水稻布局、促进水稻生产的可持续发展具有重要意义。本研究基于1985年以来的县域水稻生产数据, 分析了我国水稻产量、面积和单产的时空动态变化特征和水稻生产重心迁移轨迹, 在此基础上量化了水稻面积和单产对总产的贡献度。结果发现, 我国水稻产量变化以49年周期为主, 21年为辅, 面积变化周期为26年, 单产变化周期为60年; 1985—2015年间, 在水稻种植区域内, 近50%地区产量上升, 约70%播种面积减少, 80%以上区域单产增加; 我国水稻产量、面积重心分别向东北方向迁移229 km和225 km, 而东北稻作区产量、面积重心分别向北偏东方向迁移238 km和242 km; 我国水稻生产主导因素中单产占比由56.3%下降至28.3%, 面积由34.7%上升至63.1%。结果表明, 全国各稻作区单产提升、东北早熟单季稻区面积增加、华中双单季稻区和华南双季稻区面积减少是我国水稻种植面积变化的主要特征。因此, 合理布局我国水稻的种植面积和持续提高的水稻单产是稳定和提升我国水稻产量的主要措施, 充分利用光热资源、提高机械化程度和比较效益是促进我国水稻生产发展的关键途径。
| [1] |
Peng S B, Huang J L, Sheehy J E, Laza R C, Visperas R M, Zhong X H, Centeno G S, Khush G S, Cassman K G . Rice yields decline with higher night temperature from global warming. ProcNatlAcadSci USA, 2004,101:9971-9975
doi: 10.1073/pnas.0403720101 |
| [2] |
彭少兵 . 转型时期杂交水稻的困境与出路. 作物学报, 2016,42:313-319
doi: 10.3724/SP.J.1006.2016.00313 |
|
Peng S B . Dilemma and way-out of hybrid rice during the transition period in China. ActaAgron Sin, 2016,42:313-319 (in Chinese with English abstract)
doi: 10.3724/SP.J.1006.2016.00313 |
|
| [3] | 杨万江, 陈文佳 . 中国水稻生产空间布局变迁及影响因素分析. 经济地理, 2011,31:2086-2093 |
| Yang W J, Chen W J . Studies on the spatial distribution changing of China’s rice production and its influencing factors. Econ Geogr, 2011,31:2086-2093 (in Chinese with English abstract) | |
| [4] | 钟甫宁, 刘顺飞 . 中国水稻生产布局变动分析. 中国农村经济, 2007, ( 9):39-44 |
| Zhong F N, Liu S F . Analysis of changes in rice production layout in China. Chin Rural Econ, 2007, ( 9):39-44 (in Chinese) | |
| [5] | 胡忠孝 . 中国水稻生产形势分析. 杂交水稻, 2009,24(6):1-7 |
| Hu Z X . Analysis of the situation of rice production in China. Hybrid Rice, 2009,24(6):1-7 (in Chinese with English abstract) | |
| [6] |
Liu Z H, Li Z G, Tang P Q, Li Z P, Wu W B, Yang P, You L Z, Tang H J . Change analysis of rice area and production in China during the past three decades. J GeogrSci, 2013,23:1005-1018
doi: 10.1007/s11442-013-1059-x |
| [7] |
刘书通, 李春生, 方福平, 张小惠, 毛一剑, 孔宪琴, 张克勤, 吴荣梁 . 我国水稻生产区域变化及其比较优势分析. 中国稻米, 2014,20(4):9-13
doi: 10.3969/j.issn.1006-8082.2014.04.002 |
|
Liu S T, Li C S, Fang F P, Zhang X H, Mao Y J, Kong X Q, Zhang K Q, Wu R L . Study on the variation and comparative advantage of regional rice production structure in China. China Rice, 2014,20(4):9-13 (in Chinese with English abstract)
doi: 10.3969/j.issn.1006-8082.2014.04.002 |
|
| [8] |
程勇翔, 王秀珍, 郭建平, 赵艳霞, 黄敬峰 . 中国水稻生产的时空动态分析. 中国农业科学, 2012,45:3473-3485
doi: 10.3864/j.issn.0578-1752.2012.17.003 |
|
Cheng Y X, Wang X Z, Guo J P, Zhao Y X, Huang J F . The temporal-spatial dynamic analysis of China rice production. Sci Agric Sin, 2012,45:3473-3485 (in Chinese with English abstract)
doi: 10.3864/j.issn.0578-1752.2012.17.003 |
|
| [9] | 闵绍楷, 吴宪章, 姚长溪, 李路平 . 中国水稻种植区划. 杭州: 浙江科学技术出版社, 1989. pp 156-162 |
| Min S K, Wu X Z, Yao C X, Li L P. Regionalization of Rice Cropping in China. Hangzhou: Zhejiang Science and Technology Press, 1989. pp 156-162(in Chinese) | |
| [10] | 中华人民共和国农业部种植业司. 农作物查询(县). 北京: 中国人民共和国农业部[ 2017-09-17]. |
| Planting Division of Ministry of Agriculture of People’s Republic of China. County Crop Database. Beijing: Ministry of Agriculture of the People’s Republic of China[ 2017-09-17]. | |
| [11] | 国家统计局. 主要农作物播种面积和产量.北京: 中华人民共和国国家统计局[ 2017-12-10]. |
| National Bureau of Statistics. Production and Planting Area of Major Crops. Beijing: National Bureau of Statistics of the People’s Republic of China.[ 2017-12-10]. | |
| [12] | 中华人民共和国农业部. 中国农业年鉴.北京: 中国农业出版社, 1986- 2016 |
| Ministry of Agriculture of the People’s Republic of China. Chinese Agriculture Yearbook. Beijing: China Agriculture Press, 1986- 2016 | |
| [13] |
Grossmann A, Morlet J . Decomposition of hardy functions into square integrable wavelets of constant shape. Siam J Math Anal, 1984,15:723-736
doi: 10.1137/0515056 |
| [14] | 刘忠, 黄峰, 李保国 . 2003-2011年中国粮食增产的贡献因素分析. 农业工程学报, 2013,29(23):1-8 |
| Liu Z, Huang F, Li B G . Investigating contribution factors to China’s grain output increase in period of 2003 to 2011. TransCSAE, 2013,29(23):1-8 (in Chinese with English abstract) | |
| [15] | 孙岩松 . 我国东北水稻种植快速发展的原因分析和思考. 中国稻米, 2008, ( 5):9-11 |
| Sun Y S . Analysis and thinking of the reasons for the rapid development of rice cultivation in northeast China. China Rice, 2008, ( 5):9-11(in Chinese) | |
| [16] |
李正国, 杨鹏, 唐华俊, 吴文斌, 陈仲新, 周清波, 邹金秋, 张莉 . 气候变化背景下东北三省主要作物典型物候期变化趋势分析. 中国农业科学, 2011,44:4180-4189
doi: 10.3864/j.issn.0578-1752.2011.20.006 |
|
Li Z G, Yang P, Tang H J, Wu W B, Chen Z X, Zhou Q B, Zou J Q, Zhang L . Trend analysis of typical phenophases of major crops under climate change in the three provinces of northeast China. Sci Agric Sin, 2011,44:4180-4189 (in Chinese with English abstract)
doi: 10.3864/j.issn.0578-1752.2011.20.006 |
|
| [17] | 方福平, 潘文博 . 我国东北三省水稻生产发展研究. 农业经济问题, 2008, ( 6):92-95 |
| Fang F P, Pan W B . Development of rice production and in the three provinces in northeast China. Issu Agric Econ, 2008, ( 6):92-95 | |
| [18] |
Qiu B W, Qi W, Tang Z H, Chen C C, Wang X Q . Rice cropping density and intensity lessened in southeast China during the twenty-first century. Environ Monit Assess, 2016,188:5
doi: 10.1007/s10661-015-5004-6 pmid: 26627210 |
| [19] |
王连喜, 赵晶, 李琪, 吴荣军, 耿秀华 . 中国稻谷生产的重心演变路径及偏移分析. 农业现代化研究, 2012,33:415-419
doi: 10.3969/j.issn.1000-0275.2012.04.007 |
|
Wang L X, Zhao J, Li Q, Wu R J, Geng X H . Analysis of track and variation of paddy production gravity center of China from 1949 to 2009. Res AgricMod, 2012,33:415-419 (in Chinese with English abstract)
doi: 10.3969/j.issn.1000-0275.2012.04.007 |
|
| [20] | 刘巽浩, 胡跃高, 陈阜 . 粮食——中国农业的永恒难题与主题. 农业现代化研究, 2010,31:385-391 |
| Liu X H, Hu Y G, Chen F . The problem of cereals: eternal theme and difficult problem of Chinese agriculture. Res AgricMod, 2010,31:385-391 (in Chinese with English abstract) |
| [1] | 田甜, 陈丽娟, 何华勤. 基于Meta-QTL和RNA-seq的整合分析挖掘水稻抗稻瘟病候选基因[J]. 作物学报, 2022, 48(6): 1372-1388. |
| [2] | 郑崇珂, 周冠华, 牛淑琳, 和亚男, 孙伟, 谢先芝. 水稻早衰突变体esl-H5的表型鉴定与基因定位[J]. 作物学报, 2022, 48(6): 1389-1400. |
| [3] | 周文期, 强晓霞, 王森, 江静雯, 卫万荣. 水稻OsLPL2/PIR基因抗旱耐盐机制研究[J]. 作物学报, 2022, 48(6): 1401-1415. |
| [4] | 郑小龙, 周菁清, 白杨, 邵雅芳, 章林平, 胡培松, 魏祥进. 粳稻不同穗部籽粒的淀粉与垩白品质差异及分子机制[J]. 作物学报, 2022, 48(6): 1425-1436. |
| [5] | 颜佳倩, 顾逸彪, 薛张逸, 周天阳, 葛芊芊, 张耗, 刘立军, 王志琴, 顾骏飞, 杨建昌, 周振玲, 徐大勇. 耐盐性不同水稻品种对盐胁迫的响应差异及其机制[J]. 作物学报, 2022, 48(6): 1463-1475. |
| [6] | 杨建昌, 李超卿, 江贻. 稻米氨基酸含量和组分及其调控[J]. 作物学报, 2022, 48(5): 1037-1050. |
| [7] | 杨德卫, 王勋, 郑星星, 项信权, 崔海涛, 李生平, 唐定中. OsSAMS1在水稻稻瘟病抗性中的功能研究[J]. 作物学报, 2022, 48(5): 1119-1128. |
| [8] | 朱峥, 王田幸子, 陈悦, 刘玉晴, 燕高伟, 徐珊, 马金姣, 窦世娟, 李莉云, 刘国振. 水稻转录因子WRKY68在Xa21介导的抗白叶枯病反应中发挥正调控作用[J]. 作物学报, 2022, 48(5): 1129-1140. |
| [9] | 王小雷, 李炜星, 欧阳林娟, 徐杰, 陈小荣, 边建民, 胡丽芳, 彭小松, 贺晓鹏, 傅军如, 周大虎, 贺浩华, 孙晓棠, 朱昌兰. 基于染色体片段置换系群体检测水稻株型性状QTL[J]. 作物学报, 2022, 48(5): 1141-1151. |
| [10] | 王泽, 周钦阳, 刘聪, 穆悦, 郭威, 丁艳锋, 二宫正士. 基于无人机和地面图像的田间水稻冠层参数估测与评价[J]. 作物学报, 2022, 48(5): 1248-1261. |
| [11] | 陈悦, 孙明哲, 贾博为, 冷月, 孙晓丽. 水稻AP2/ERF转录因子参与逆境胁迫应答的分子机制研究进展[J]. 作物学报, 2022, 48(4): 781-790. |
| [12] | 王吕, 崔月贞, 吴玉红, 郝兴顺, 张春辉, 王俊义, 刘怡欣, 李小刚, 秦宇航. 绿肥稻秆协同还田下氮肥减量的增产和培肥短期效应[J]. 作物学报, 2022, 48(4): 952-961. |
| [13] | 巫燕飞, 胡琴, 周棋, 杜雪竹, 盛锋. 水稻延伸因子复合体家族基因鉴定及非生物胁迫诱导表达模式分析[J]. 作物学报, 2022, 48(3): 644-655. |
| [14] | 陈云, 李思宇, 朱安, 刘昆, 张亚军, 张耗, 顾骏飞, 张伟杨, 刘立军, 杨建昌. 播种量和穗肥施氮量对优质食味直播水稻产量和品质的影响[J]. 作物学报, 2022, 48(3): 656-666. |
| [15] | 王琰, 陈志雄, 姜大刚, 张灿奎, 查满荣. 增强叶片氮素输出对水稻分蘖和碳代谢的影响[J]. 作物学报, 2022, 48(3): 739-746. |
|
||